Fibonacci Extensions and Pivot Points Map Market Levels
Fibonacci extensions and pivot points map potential support, resistance, targets, and invalidation zones when price confirms the structure.

Fibonacci extensions and pivot points help traders map where price may react before it arrives. They do not predict the next move. Fibonacci levels project from a selected swing, while pivot points translate prior-session data into predefined support and resistance. Both become useful only when price confirms the level and risk has a defined boundary.
The practical edge is not the line itself. It is the structure around that line: how the level was calculated, how price approaches it, whether acceptance or rejection follows, and where the trade idea becomes invalid. A clean map improves preparation. It does not remove uncertainty.
How Fibonacci extensions and pivot points map levels
Fibonacci extensions and pivot points solve a similar problem from different inputs. A Fibonacci extension starts with price structure. The trader identifies a swing low, a breakout high, and a retracement low. Those anchors create projected zones above the recent high. A pivot framework starts with the previous session’s high, low, and close, then calculates a central pivot and surrounding resistance and support levels.
That distinction matters. Fibonacci is swing-based, so two traders can produce different levels if they choose different anchors. Pivot points are session-based, so traders using the same session definition and formula should begin with the same map. Neither method should be treated as a standalone entry signal.
| Tool | Primary input | Typical use | Main weakness |
|---|---|---|---|
| Fibonacci extension | Selected swing sequence | Project targets beyond a prior high or low | Poor anchors produce irrelevant levels |
| Pivot points | Previous high, low, and close | Map session support and resistance | A level can fail when price breaks without acceptance |
Fibonacci projections begin with the anchor sequence
For a bullish Fibonacci extension, mark the swing low as A, the breakout high as B, and the retracement low as C. The projection begins from that sequence. Levels such as 0.382, 0.5, and 0.618 can then identify potential resistance zones above B. The purpose is to organize possible reactions, not to claim that price must stop at a specific number.
Consider a market that rises from A to B, pulls back without losing the broader structure, and then turns higher from C. A trader can project extension zones above B and watch the first area for rejection, a clean breakout, or stronger participation. If price pauses at a projected zone but continues to hold above the broken high, the next extension may remain relevant. If price rejects sharply and loses acceptance, the projection has done its job by identifying a decision area.
The common mistake is false precision. A projected value is better treated as a zone than an exact price. Orders, liquidity, and volatility do not organize themselves around a perfectly thin line. When several nearby levels cluster, the entire area deserves attention.
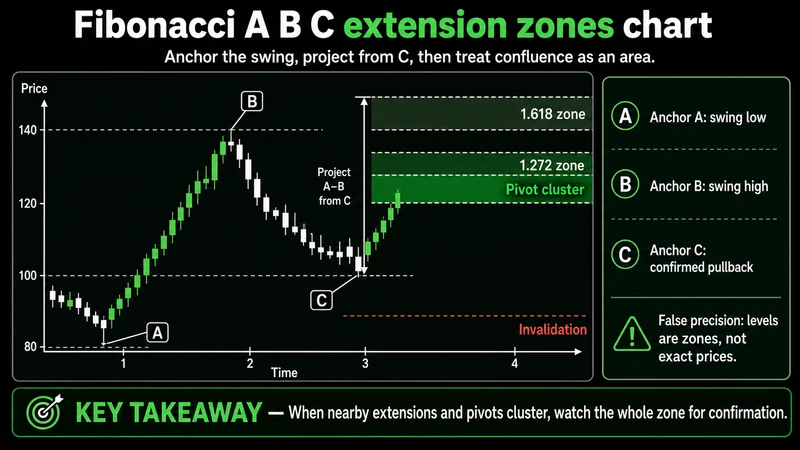 A clean A-B-C sequence projects extension zones above the recent high.
Pivot breakouts require a close and continued acceptance
Pivot points use the previous session’s high, low, and close to calculate a central pivot, labeled P, with resistance levels above it and support levels below it. R1, R2, and R3 act as potential resistance. S1, S2, and S3 act as potential support. These levels create a session map before price begins moving through them.
A bullish setup can develop when price closes above R1 and then holds the breakout area. R2 becomes the first logical target, followed by R3 if momentum and acceptance continue. The invalidation belongs below the failed breakout area, not at an arbitrary distance. The bearish sequence is the mirror image: a close below S1 can open a path toward S2 and S3, while the stop belongs above the failed breakdown area.
A candle touching R1 is not enough. The quality of the close matters, and the next response matters more. If price immediately falls back below R1, the move may be a liquidity sweep rather than a valid breakout. Confirmation means the market can remain on the new side of the level long enough to show acceptance.
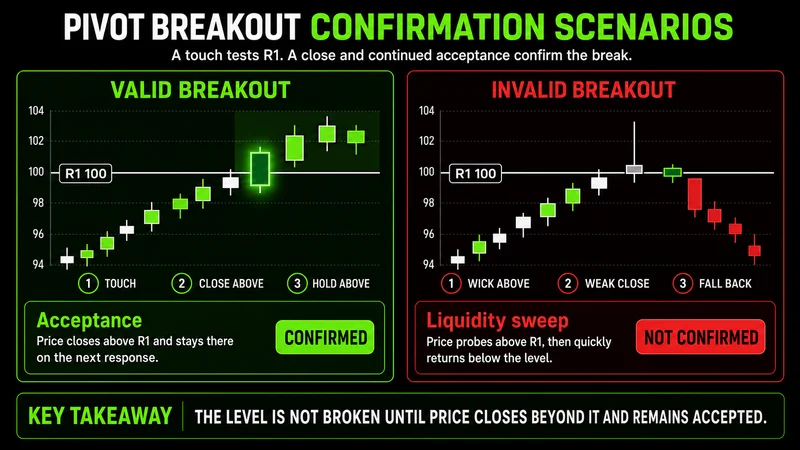 A pivot breakout needs a close, continued acceptance, and defined failure level.
Confirmation determines whether a level becomes tradable
A useful level is not automatically a useful trade. The trader still needs evidence from price behavior. Rejection can show that the market tested a zone and failed to continue. A breakout followed by a hold can show acceptance. Expanding volume may strengthen the case when it accompanies clean displacement, although volume alone does not repair weak structure.
“Do not treat either tool as a standalone signal.” — MRPNL
This is where process replaces prediction. Mark the level in advance. Observe the approach. Wait for the response. Define the risk only after the market shows which side is gaining control. If confirmation requires a wide stop relative to the next target, the trade may be structurally valid but economically poor.
The best entries often occur after information improves, not at the first touch. With Fibonacci, that may mean a bounce from a retracement area before targeting an extension. With pivots, it may mean a close beyond R1 or S1 followed by a successful hold. Waiting reduces frequency, but frequency is not the objective. Execution quality is.
A concrete plan combines context, entry, target, and invalidation
Assume price is advancing from a clear swing low, breaks a prior high, and retraces without losing the new higher-low structure. The trader marks A, B, and C, then projects extension zones above B. The same session map shows R1 near the broken high and R2 close to the first extension zone.
That overlap creates a decision area, not certainty. The trader waits for price to close above R1 and hold it on a retest. Entry follows confirmation rather than anticipation. The first target is the nearby extension and R2 zone. Risk sits below the failed breakout area or below C, depending on which level defines the actual thesis. Position size must adapt to that distance.
The trade remains valid while price holds the breakout structure and continues accepting above R1. It weakens if momentum stalls repeatedly below the target zone. It is invalid if price decisively loses the level that justified entry. Moving the invalidation after the fact changes the trade rather than managing it.
Common mistakes turn useful maps into weak signals
Most errors come from how the tools are applied, not from the calculations themselves.
- Choosing Fibonacci anchors from minor noise instead of a visible swing sequence.
- Treating an extension as an exact reversal price.
- Entering a pivot break on the first touch without waiting for a close or hold.
- Placing a stop directly on the level where normal testing can reach it.
- Selecting targets without checking whether the next logical level leaves enough room for the defined risk.
- Combining several nearby lines and calling the cluster confirmation.
The last mistake is subtle. Confluence can improve context, but two calculated levels do not create independent evidence when both are reacting to the same price move. Price still has to confirm the area.
When this approach does not work
These tools lose quality when the underlying structure is unclear. Fibonacci projections become unreliable when A, B, and C are selected from choppy, overlapping movement. Pivot breakouts also fail more often when price repeatedly crosses P, R1, or S1 without holding either side. In those conditions, the map may be accurate, but execution remains low quality.
The framework can also break down when volatility expands faster than confirmation develops. Price may move through several projected or pivot levels before a trader can define reasonable risk. A late entry then places the stop far from the target or forces risk inside normal price noise. The correct response is to skip the trade, not compress the invalidation until the numbers look acceptable.
Thin participation creates another limitation. A brief push beyond a level can appear decisive and then reverse without sustained acceptance. When liquidity is inconsistent, the breakout candle carries less information. Structure that reads cleanly during active conditions may mean very little during a thin period.
Use a decision process before every entry
A disciplined application can be reduced to a short sequence:
- Identify whether the market is producing a clean swing or approaching a defined session level.
- Mark Fibonacci anchors or pivot levels before planning the entry.
- Treat projected values as zones and pivot breaks as unconfirmed until price closes and holds.
- Set the next logical level as the target only if it provides enough room relative to invalidation.
- Place risk beyond the structure that would prove the idea wrong.
- Skip the setup when anchors are ambiguous, acceptance is absent, or volatility makes the risk inefficient.
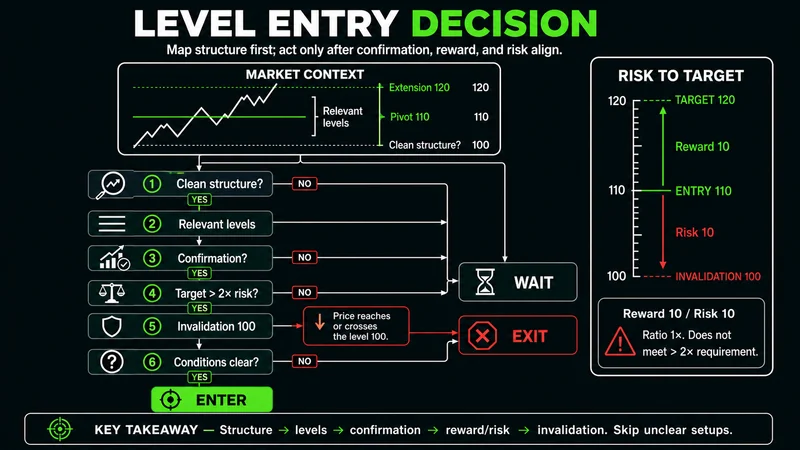 Move from mapped level to confirmation, target, invalidation, or no trade.
Fibonacci extensions and pivot points are mapping tools. Their value comes from separating preparation from reaction. The level identifies where to pay attention. Confirmation defines the entry. The next logical zone frames the target. Invalidation controls the loss when the market rejects the thesis. That sequence keeps the process reactive, risk-defined, and grounded in observable price behavior.
Worth the read?