Support and Resistance Trading With RSI and MACD
Support and resistance trading works best when price confirms the level first, while RSI and MACD support timing, risk, and invalidation.
Support and resistance trading becomes clearer when price location comes first and indicators come second. RSI and MACD can confirm a developing reversal, but neither indicator turns a weak level into a valid trade. The setup begins with a visible support zone, then requires rejection, a trendline break, and defined invalidation.
That sequence matters. An oversold RSI reading can persist while price continues lower. A bullish MACD crossover can also arrive after much of the move is complete. The indicators are useful when they confirm price behavior at a level traders can identify before the signal appears.
Support and resistance trading starts with location
Support is better treated as a zone than a precise line. Mark the area around a prior swing where buyers previously interrupted a decline or started an advance. When price returns, the first task is not to predict a bounce. It is to observe whether selling pressure weakens and whether price can reject or reclaim the zone.
A clean example begins with price declining into a visible support zone beneath a sequence of lower highs. The first candle inside the zone is not automatically an entry. A stronger case develops when price tests the area, rejects the low, and closes back above the zone. The rejection low then creates a practical invalidation reference.
The next resistance or prior pullback area provides a logical profit objective. That target is structural, not arbitrary. If the distance from entry to resistance is too small relative to the distance from entry to invalidation, the trade may be technically valid but poorly positioned.
The chart sequence is simple: mark the prior swing zone, wait for a test, demand a bullish rejection or reclaim, define risk below the rejection low, and identify resistance before entering. The indicator reading supports this sequence; it does not replace it.
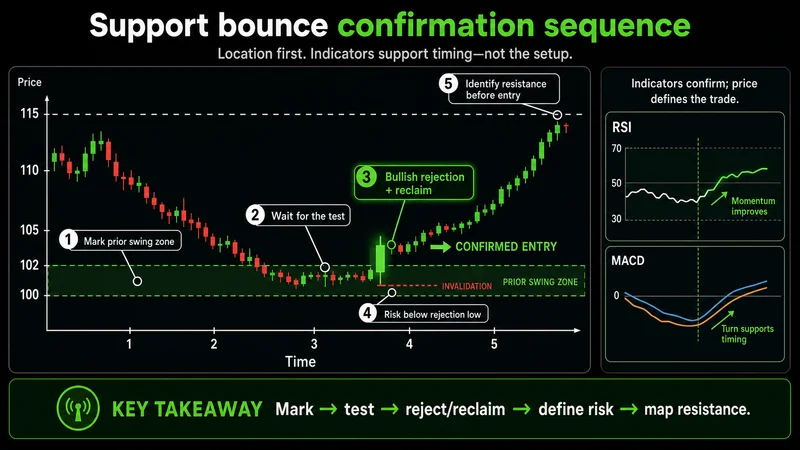 A support test becomes actionable only after rejection defines confirmation and risk.
RSI should confirm exhaustion and recovery
RSI 14 provides three useful references in this framework: 30 for oversold conditions, 50 as the midpoint, and 70 for overbought conditions. An RSI reading near or below 30 warns that downside momentum may be stretched. It does not prove that buyers have taken control.
The more useful information comes from what happens next. If price rejects support while RSI turns higher from the oversold area, the two observations point in the same direction. Confirmation improves again when RSI recovers through 50 as price breaks a descending trendline or holds a reclaim.
Consider price touching support while RSI prints 29. Buying immediately assumes the reading will reverse. Waiting for a bullish candle, a close back above support, and RSI recovery removes some uncertainty. The entry may be higher, but the decision is based on observed acceptance rather than hope.
The common mistake is treating 30 as a buy command and 70 as a sell command. Momentum readings describe conditions. They do not define structure, timing, or risk. In a strong decline, RSI can remain depressed while support continues to fail.
A trendline break turns a bounce into evidence
A descending trendline drawn across lower highs organizes the pressure leading into support. Price remains structurally constrained while that line holds. A break above it shows that the immediate sequence of lower highs is being challenged, but one candle through the line is still incomplete evidence.
A better confirmation is a break that holds or survives a retest. Price should remain above the trendline or the breakout base rather than fall directly back into the prior decline. This creates a clearer entry reference and separates a momentary spike from a change in price behavior.
The support bounce and trendline break answer different questions. Support identifies where a reversal could develop. The break shows whether buyers can move price beyond the short-term downtrend. Requiring both reduces frequency, which is often the correct cost for better execution quality.
MACD confirms momentum after price does the work
A bullish MACD condition appears when the MACD line crosses above the signal line. A strengthening positive histogram can support the same momentum shift. The crossover carries more weight when it occurs as price rejects support and breaks the descending trendline.
The order of evidence matters. First, price reaches a visible support zone. Second, rejection limits the immediate downside. Third, price breaks or reclaims the trendline. Fourth, MACD crosses above its signal line as momentum improves. The entry follows confirmation, with risk below support, the rejection low, or the breakout base.
Two setups can display the same MACD crossover and have different quality. In the first, the crossover develops at support while price holds above a broken trendline. In the second, it appears in the middle of a range with no defined level. The first has context and invalidation. The second has only an indicator event.
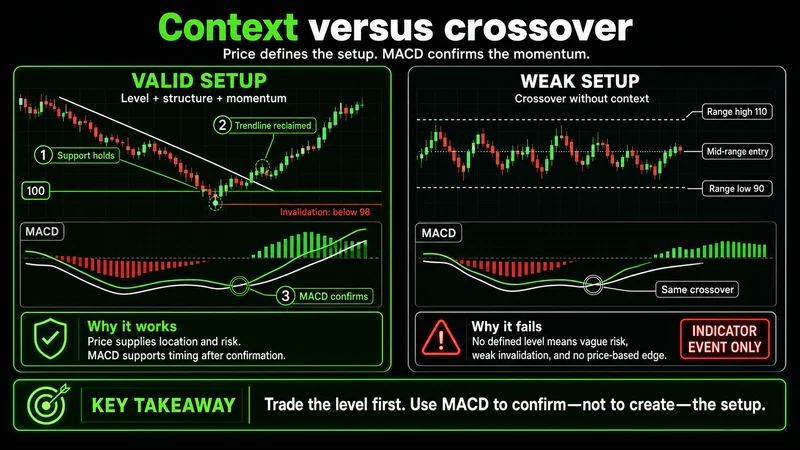 The same MACD signal has different value depending on price structure and location.
“Confirmation is useful only when it produces a defined decision.” — MRPNL
Build the entry, exit, and invalidation before execution
Start by marking visible support and the next resistance or prior swing area. Draw the descending trendline across the relevant lower highs. Then wait for price to test support without assuming it will hold.
A practical long setup requires a rejection or reclaim at support, followed by a trendline break that holds or retests. RSI should turn higher from an oversold area and may reclaim 50 as strength develops. MACD should cross above its signal line or show improving histogram momentum. Not every condition must occur on one candle, but the sequence should remain coherent.
Place invalidation below the support rejection low or below a clearly defined breakout base. If price closes below support, the original premise is wrong because the level failed to hold. The stop belongs where the market disproves the setup, not where the loss happens to feel comfortable.
Use the next resistance or prior pullback zone as the first target reference. If price approaches that area without continued momentum, manage the position rather than assuming a breakout. A clean entry does not guarantee clean continuation.
The decision process can be reduced to three outcomes: no rejection means no entry; rejection without breakout means continue waiting; rejection plus a confirmed breakout allows a risk-defined entry. A close below support invalidates the long premise.
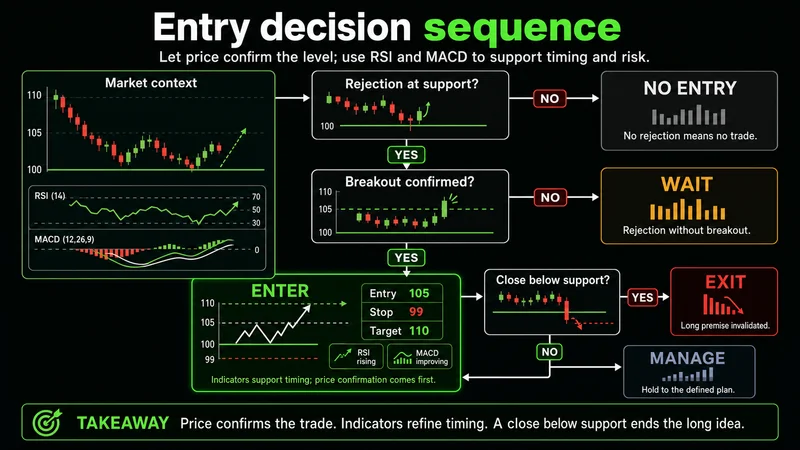 Rejection, breakout confirmation, and structural invalidation determine whether to enter or wait.
Common mistakes weaken otherwise valid signals
Entering on the first touch of support is the most direct mistake. A zone is a location to watch, not a promise that price will reverse. Waiting for rejection reduces the chance of buying while sellers remain in control.
Another mistake is counting correlated indicators as separate proof. RSI and MACD both measure momentum from price. Their agreement is useful, but price structure must remain the primary evidence. Two indicators cannot repair a failed support zone.
Traders also place stops inside the support area, where normal testing can trigger an exit before the setup resolves. The invalidation level should sit beyond the rejection low or another structural boundary. Position size must then adapt to that distance.
Finally, targeting open space without identifying nearby resistance can create unrealistic expectations. The next prior swing or resistance zone should be visible before execution.
When this framework does not work
This approach loses reliability when support is vague, price is moving through thin or erratic conditions, or volatility expands so quickly that confirmation arrives far from invalidation. It also breaks down when a supposed trendline depends on forced anchor points rather than a clear sequence of lower highs.
A close below support invalidates the bullish premise even if RSI remains oversold or MACD begins to turn. Indicators may lag the structural failure. Holding because an oscillator still looks favorable replaces risk control with prediction.
The framework is also a poor fit when resistance sits immediately above the proposed entry. There may be confirmation without enough room for the trade to develop. Passing on that setup protects capital from a structurally weak position.
Practical application favors patience over frequency
Before acting, ask five questions. Is support visible without adjusting the chart to make it fit? Did price reject or reclaim the zone? Did the descending trendline break and hold? Are RSI and MACD confirming the same recovery? Is invalidation defined below structure with a realistic target at resistance?
If one of the structural answers is missing, wait. Support provides location, price action provides confirmation, RSI measures recovery, and MACD tracks the momentum shift. Risk remains anchored below the level that must hold. The value of the method is not prediction. It is a controlled sequence that makes the trade idea testable before capital is committed.
Worth the read?