Ichimoku Cloud Breakout and Hold Strategy
Use an Ichimoku Cloud breakout and hold strategy to confirm trend direction, measure strength, define invalidation, and manage risk.

An Ichimoku Cloud breakout and hold strategy treats the breakout as an alert, not an automatic entry. The useful information comes next: price must remain above the cloud, preserve bullish structure, and show enough trend strength to justify participation. If price loses acceptance and falls back through the cloud, the original trade logic is no longer intact.
This is a trend-following framework. It keeps the trader aligned with the move until the evidence changes. The cloud defines the regime, price behavior confirms direction, ADX measures strength, and a clear invalidation controls risk.
Ichimoku Cloud breakout and hold strategy starts with regime
The Ichimoku Cloud creates a visible zone of support and resistance. Price above the cloud represents a bullish regime. Price below it removes the long bias and calls for exit caution. That distinction is more useful than trying to predict every turn because it defines which side of the market deserves attention.
A breakout occurs when price moves through the upper boundary. A hold requires more. Price must stay above the cloud after the initial push rather than immediately closing back inside it. The strongest version combines a breakout, continued acceptance, and higher highs with higher lows.
The cloud also communicates context through its thickness. A thick cloud represents a stronger support or resistance zone. That makes a later test more meaningful: a controlled bounce can support the bullish case, while a decisive move through the zone carries more weight than a minor intrabar touch.
A valid bullish sequence has three visible stages: price begins below or inside the cloud, breaks through the upper boundary, and then holds above it while the next candles preserve higher lows. The breakout identifies a possible regime change. The hold confirms that buyers have maintained control after crossing resistance.
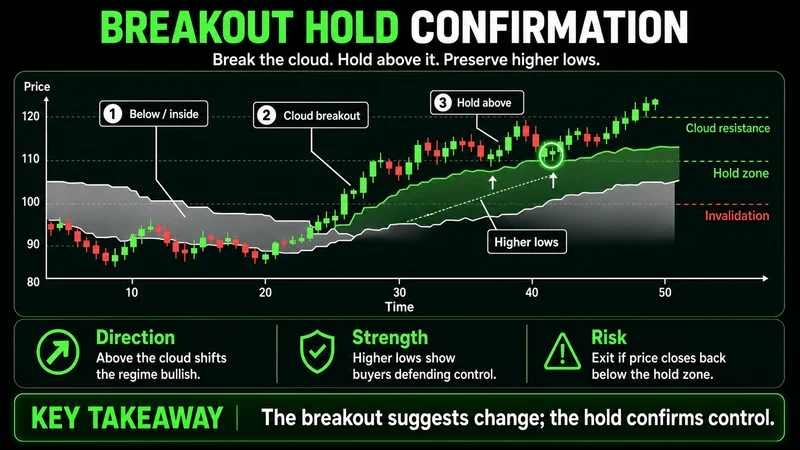 A breakout becomes stronger when the pullback holds above the cloud and price resumes higher.
Confirmation matters more than the first breakout candle
The first candle above the cloud can look decisive and still fail. Confirmation comes from what price does after that candle. Continued trading above the cloud, a higher low, and renewed expansion provide better evidence than the size or color of the breakout candle alone.
A practical trigger is a breakout followed by a hold above the cloud. The entry does not need to occur at the highest point of the move. Waiting for acceptance can reduce the risk of buying a brief push that immediately reverses. It also creates a cleaner place to define when the idea is wrong.
Consider a generic sequence. Price trades beneath the cloud, pushes through it, and then pulls back. The pullback stops above the upper cloud boundary. The next advance breaks the pullback high while the broader swing sequence remains constructive. That is a confirmed continuation attempt, not simply a candle that happened to close above an indicator.
The common mistake is entering because price touched or barely crossed the cloud. A touch does not establish acceptance. If the next candles return inside the cloud, the market has not confirmed the bullish regime. The trader is then exposed to a transition rather than an established trend.
The breakout gets attention. The hold determines whether the move deserves risk.
ADX separates direction from trend strength
ADX adds a different piece of information. It measures trend strength, not direction. A rising ADX does not independently tell a trader to buy or sell. Price location and structure must establish direction first.
The threshold shown in this framework is 25. ADX below 25 identifies weak or sideways conditions where trend-following signals deserve caution. A cross above 25 suggests that the trend has enough strength to become tradable, provided price has already supplied a directional filter.
The sequence matters. First, price breaks and holds above the Ichimoku Cloud. Second, market structure remains bullish. Third, ADX moves above 25 and confirms that momentum is developing. ADX is confirmation of strength, not permission to ignore price behavior.
Two markets can show the same ADX reading and require opposite decisions. One may be advancing above the cloud, while another may be declining below it. ADX describes the force of each move. The cloud and price structure identify the side. Combining them prevents a strength reading from being mistaken for a directional signal.
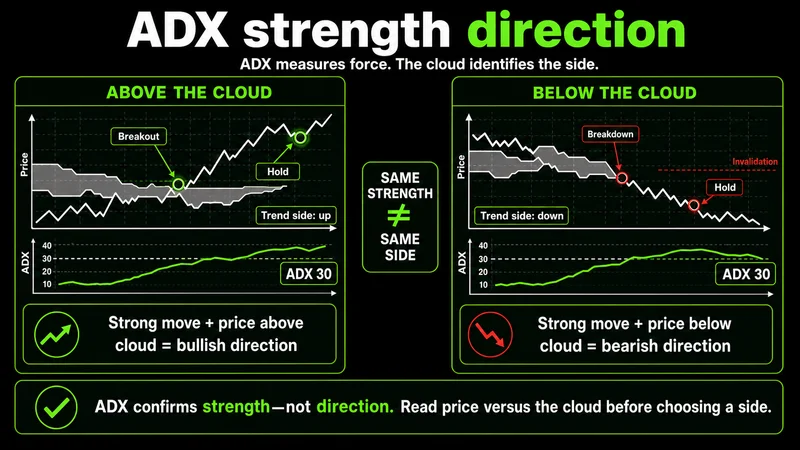 ADX measures the force of a move, while price and the cloud determine its direction.
Moving averages provide a slower trend filter
A moving average offers a simpler view of the same regime question. The 200-period moving average is a long-term filter: price above it supports a bullish bias, while price below it calls for bearish or exit caution. A reclaim and hold above the average is more useful than a brief cross.
The 20-period exponential moving average can serve a faster role. During an uptrend, a rising 20 EMA can help track the active trend line as price makes higher highs and higher lows. The slower 200-period average defines the broader backdrop. The faster 20 EMA helps monitor the current move.
These tools should not be treated as competing entry buttons. If price is above the Ichimoku Cloud and the 200-period moving average, the directional evidence agrees. If the readings conflict, the market may be transitioning. Reduced size, more confirmation, or no trade is cleaner than forcing a trend label onto mixed conditions.
SuperTrend can organize risk after confirmation
SuperTrend converts trend direction into a visual line that flips with the move. A flip to green can mark a bullish trigger. Once the position is active, the line can also function as a dynamic stop reference rather than merely another entry signal.
That dual role is useful because the trade remains tied to observable behavior. As the trend advances, the stop reference can rise beneath price. If the indicator flips back to the exit side, the framework recognizes that the trend evidence has changed.
The risk plan begins with the distance from entry to the initial stop, defined as 1R. Profit objectives can then be organized as a ladder, such as 1R, 1.5R, and 2R. The purpose is not to guarantee those targets. It is to prevent an open profit from becoming an undefined decision made under pressure.
A target ladder and a trailing SuperTrend line solve different problems. Targets define where profit may be reduced. The trailing line defines when the remaining position no longer has structural support. Using both creates a plan before volatility forces a reactive choice.
Defined invalidation keeps the setup risk-controlled
The cleanest invalidation is a failed hold. If price breaks above the cloud, returns inside it, and cannot reclaim the upper boundary, the bullish premise has weakened. A decisive move below the cloud removes the long bias entirely.
A complete invalidation check should remain simple:
- Price loses acceptance above the cloud.
- The higher-low sequence breaks.
- ADX falls back into weak conditions instead of confirming momentum.
- SuperTrend flips to the exit side.
- The initial stop is reached before the setup proves itself.
Not every warning needs to occur at once. The initial stop defines the maximum planned loss. The other conditions help determine whether the trade should be reduced or closed before that limit is reached. The key is to decide the response in advance.
This setup is invalid when price closes back inside the cloud, fails to recover the upper boundary, and breaks the higher low that supported the breakout. At that point, the evidence no longer describes a breakout and hold. It describes a failed transition, so the original long thesis should not be defended.
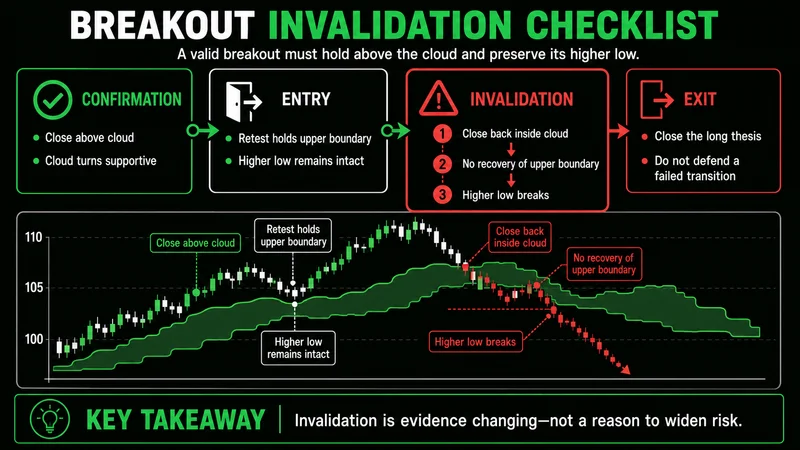 The long thesis fails when price loses the cloud, cannot reclaim it, and breaks the supporting higher low.
When this trend framework does not work
This approach loses quality in sideways conditions. When price repeatedly moves through the cloud and ADX remains below 25, trend signals can flip without sustained follow-through. The same tools that organize a clean directional move can produce repeated entries and exits when no trend is present.
It also performs poorly when the trader reacts to every indicator independently. A green SuperTrend flip without a cloud hold, or an ADX move above 25 without directional price confirmation, is incomplete evidence. Stacking indicators only helps when each one answers a different question.
A thick cloud can also delay a clean transition because it represents a substantial support or resistance zone. Price may enter the cloud and remain there. During that period, neither side has established clear control. Waiting outside the cloud is part of the strategy, not a missed trade.
A disciplined application uses a fixed sequence
Start with regime. Require price above the Ichimoku Cloud and, when broader context is needed, above the 200-period moving average. Then evaluate structure. Higher highs and higher lows should support the bullish direction.
Next, wait for the breakout to hold. A pullback that respects the upper cloud boundary is stronger evidence than an isolated close above it. Use ADX above 25 to confirm strength, not direction. After entry, define 1R from entry to the initial stop, use SuperTrend as a dynamic risk reference, and plan profit reductions before the trade develops.
The process can be reduced to five decisions:
- Is price above the cloud and aligned with bullish structure?
- Did the breakout hold after the first move?
- Is ADX above 25 and confirming trend strength?
- Where is the defined invalidation?
- How will risk be reduced if price reaches 1R, 1.5R, or 2R?
The method is reactive, not predictive. Price establishes the regime. The hold confirms acceptance. ADX confirms strength. SuperTrend and the cloud define when conditions have changed. That sequence keeps attention on execution quality instead of the excitement of the first breakout candle.
Worth the read?