Indicator Combinations for Trading That Confirm Setups
Indicator combinations for trading work when context, momentum, and price confirmation agree while invalidation remains defined before entry.

Indicator combinations for trading work when each tool has a separate job. One defines direction or location. Another confirms momentum. Price behavior triggers the trade. The combination does not remove uncertainty. It filters weak conditions and makes invalidation easier to define before capital is exposed.
The common mistake is stacking indicators that measure the same thing, then treating agreement as independent confirmation. Three momentum oscillators can produce three green signals while adding only one piece of information. A useful combination separates context, confirmation, execution, and risk.
How indicator combinations for trading should divide the work
Every combination needs a clear sequence. Start with market context. Decide whether price is trending, ranging, or rotating around a reference level. Use the first indicator to define that environment. Use the second to confirm strength or exhaustion. Enter only after price supplies a trigger, such as a controlled pullback, rejection, or reclaim.
The decision process is simple: identify the regime, wait for indicator agreement, require price confirmation, and define the level that proves the idea wrong. If the indicators agree but price never confirms, there is no trade. If price confirms but the invalidation is too wide, the setup still fails the risk test.
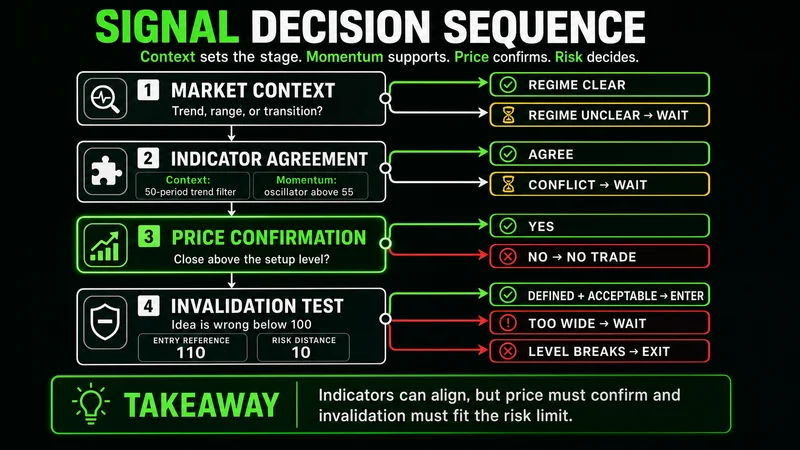 A valid setup progresses from market regime to confirmation, execution, and risk.
“Indicators are tools, not decision-makers.” — MRPNL
That distinction matters because indicators are derived from price. They can organize information, but they cannot replace structure, liquidity, or execution. The best combinations reduce conflict between signals. They do not predict the next candle.
Five combinations work under different market conditions
The five combinations below use RSI as confirmation, but they do not use it in the same way. In a trend, RSI can confirm sustained strength. Near a volatility boundary, it can identify an extended condition. Around VWAP, it can help judge whether a pullback remains constructive. The threshold only matters inside the correct context.
| Combination | Primary job | Confirmation | Practical trigger | Defined invalidation |
|---|---|---|---|---|
| 9 and 21 EMA with RSI | Trend direction | RSI holds above 50 | Pullback toward the EMAs holds | Price loses the trend structure and RSI weakens |
| MACD with RSI | Momentum shift | RSI crosses 50 with the MACD cross | Price confirms the shift after the cross | MACD reverses and RSI falls back through 50 |
| Bollinger Bands with RSI | Volatility boundary | RSI moves below 30 | Lower-band tag produces a bounce | Price accepts below the lower band |
| VWAP with RSI | Intraday directional bias | RSI holds near 40–50 | Pullback holds VWAP and turns higher | Price loses VWAP with acceptance |
| Stochastic with RSI | Range reversal | Both turn from near 20 | Price curls higher from range support | Oscillators turn down or support fails |
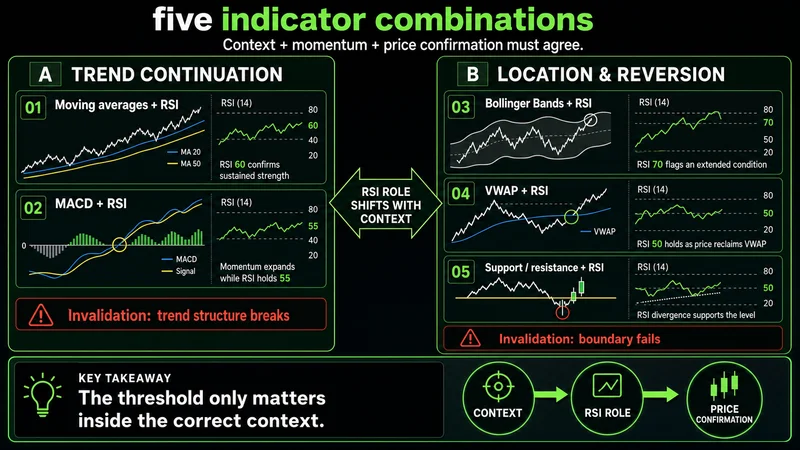 Each combination matches a different market condition, trigger, and invalidation.
Double EMA and RSI organize a trend pullback
The 9 and 21 EMAs establish direction. When the faster average remains above the slower average and both slope higher, the market has a bullish trend framework. RSI holding above 50 confirms that momentum remains constructive. The practical entry is not the crossover itself. It is a pullback toward the averages that stabilizes and turns higher.
This combination is strongest when the averages are separated and price respects them without repeated whipsaws. A close through both averages, followed by failed recovery, weakens the premise. RSI losing 50 adds confirmation that momentum is no longer supporting the trend.
MACD and RSI confirm an early momentum shift
A bullish MACD cross shows that short-term momentum is improving relative to its signal line. RSI crossing above 50 confirms that the change is broad enough to move momentum into stronger territory. Together, they can help time the transition from weak price behavior to an advancing phase.
Do not buy simply because two lines crossed. Price should also reclaim a meaningful level or form a higher low. If MACD crosses back below its signal while RSI drops under 50, the momentum thesis has failed. That is an exit or caution condition, not an invitation to average down.
Bollinger Bands and RSI frame a mean-reversion attempt
A lower Bollinger Band tag shows that price has reached the lower edge of its recent volatility envelope. RSI below 30 identifies an extended momentum condition. The setup becomes actionable only when price rejects the lower band and begins to recover. The middle band is a logical first target because it represents the center of the envelope.
A band touch is not automatic support. Strong trends can keep price against the lower band while RSI remains oversold. Acceptance below the band invalidates the immediate bounce thesis. Wait for rejection and improving price behavior before treating the condition as a reversal.
VWAP and RSI define an intraday pullback
VWAP provides an intraday reference for directional control. When price trades above it, the long side has better context. A pullback that holds VWAP while RSI stabilizes between 40 and 50 can show that momentum has cooled without fully breaking.
The trigger is a higher low or clear reclaim above the pullback structure. The risk belongs below the level that defended VWAP, not at an arbitrary distance. If price loses VWAP and accepts below it, the long-only premise is invalid. A quick line touch without acceptance is noise; sustained trade below the reference is the meaningful change.
Stochastic and RSI are better suited to ranges
Stochastic and RSI can provide double confirmation when both turn higher from an oversold area near 20. This works best near established range support, where price has already shown repeated rejection. The oscillators identify exhaustion, while the price reaction supplies the entry.
This pairing is weaker in persistent trends. Both oscillators can remain oversold while price continues lower. If range support breaks, the original reversal framework no longer exists. The trade should be closed according to the price invalidation rather than held because the indicators still look stretched.
A concrete pullback example separates signal from execution
Assume price is above VWAP and has formed a sequence of higher lows. RSI cools from stronger readings into the 40–50 area as price pulls back toward VWAP. The setup is not active yet. A bullish response appears only when price rejects the reference, closes back above the short pullback structure, and preserves the latest higher low.
The entry follows that price confirmation. The invalidation sits below the defended low and VWAP acceptance zone. If price closes below the reference, fails to reclaim it, and RSI continues weakening, the premise is no longer a constructive pullback. The loss is defined by structure rather than by hope.
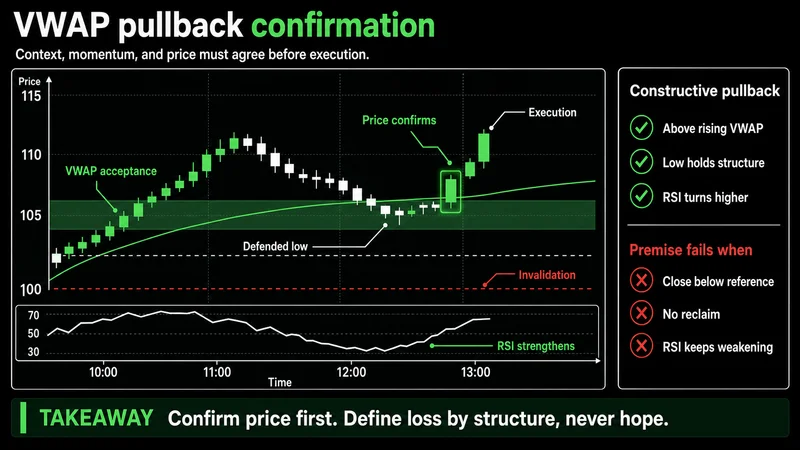 VWAP sets location, RSI qualifies the pullback, and price structure defines execution and risk.
This example shows why order matters. VWAP establishes location. RSI describes the quality of the pullback. Price supplies the trigger. Structure defines the risk. Reversing that order often creates premature entries because the trader reacts to RSI before the market confirms support.
Common mistakes turn confirmation into false confidence
The first mistake is redundancy. RSI, Stochastic, and MACD all describe momentum in different forms. Combining them without a trend or location tool can make one condition look more convincing than it is.
The second mistake is ignoring the market regime. Bollinger Band reversals and dual-oscillator turns fit balanced conditions better than strong directional expansion. EMA pullbacks and VWAP holds need orderly trends. Applying the wrong combination to the wrong environment creates repeated fakeouts.
The third mistake is moving invalidation after entry. A setup is not valid because two indicators still agree. It remains valid only while the price condition supporting the trade is intact.
Defined invalidation must come from price behavior
Indicator crosses are useful warnings, but price should define the final boundary. For an EMA pullback, invalidation may be acceptance below both averages and the supporting swing. For a VWAP long, it is sustained trade below VWAP after a failed reclaim. For a range reversal, it is a clean break of range support.
Write the invalidation before entering. Then size the position around that distance. If the required stop makes the exposure unacceptable, skip the setup. A clean signal with poor risk is still a low-quality trade.
When these combinations do not work
These combinations break down during disorderly volatility, thin liquidity, and rapid transitions between market regimes. A momentum cross can reverse before the candle closes. VWAP can be crossed repeatedly in a balanced session. RSI can remain extended through a persistent trend. Bollinger Bands can expand faster than a mean-reversion trade can recover.
They also lose value when scheduled news causes abrupt repricing. Historical inputs react after price moves, so confirmation may arrive too late or disappear immediately. Under those conditions, smaller exposure, wider patience, or no trade is usually more disciplined than forcing the framework.
A practical routine keeps the process consistent
Before the session, classify the expected environment without predicting direction. Mark trend structure, range boundaries, and VWAP. Select one combination that matches the observed regime rather than switching indicators after every losing signal.
During execution, use this sequence:
- Confirm that price is in the environment the combination requires.
- Wait for the indicators to agree on direction or exhaustion.
- Require a price trigger at a meaningful location.
- Define invalidation and position risk before entry.
- Exit when the price premise fails, even if an indicator lags.
After the trade, review whether each tool performed its assigned role. The goal is not to find a combination that always works. The goal is to remove low-quality conditions, keep decisions reactive, and make every trade accountable to a visible price boundary.
Better confirmation begins with fewer responsibilities
Reliable indicator combinations do not create certainty. They create a disciplined division of labor. One tool defines context, another confirms, price triggers execution, and structure controls risk. When those parts align, the setup is clearer. When they conflict, waiting is the position.
Worth the read?