Fibonacci Trading Setups With EMA and RSI
Fibonacci trading setups combine retracement zones, EMA structure, RSI momentum, price confirmation, and defined invalidation for controlled execution.
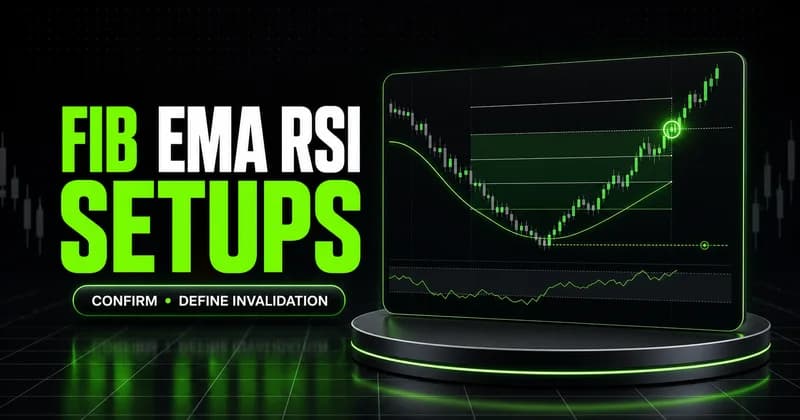
Fibonacci trading setups work best as a framework for organizing evidence, not as automatic signals. A retracement level identifies a possible reaction zone. EMA structure adds directional context, RSI shows momentum conditions, and price behavior provides confirmation. The setup becomes actionable only when those pieces align with defined invalidation.
The distinction matters. A level can be technically correct and still produce no trade. Price must reach the area, react with intent, and preserve the structure supporting the idea. Without that sequence, the chart contains a Fibonacci drawing, not a complete setup.
Fibonacci trading setups require three layers of evidence
A disciplined setup separates location, trend, and timing. Fibonacci supplies the location. The EMA relationship helps define the prevailing directional bias. RSI describes momentum and whether pressure may be changing. None of the three should make the decision alone.
The cleanest process is sequential. First, identify a completed swing that is clear enough to anchor the retracement. Second, decide whether the broader structure supports continuation or rejection. Third, wait for price behavior inside the Fibonacci zone. The indicator evidence should confirm what price is already beginning to show.
This sequence prevents a common analytical error: collecting indicators until they justify a position already chosen. Confirmation has value only when the conditions were defined before price reached the zone.
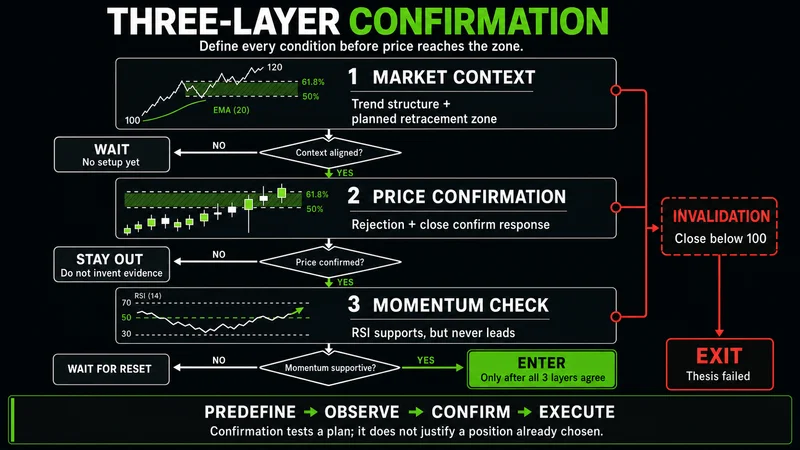 A valid setup moves from location to trend context, price reaction, and momentum confirmation.
A Fibonacci level marks where attention belongs. Acceptance or rejection determines whether risk belongs there.
Draw the Fibonacci retracement from a completed swing
The anchor points determine every level that follows. For a long setup in an uptrend, draw from the swing low to the swing high. For a short setup built around a bearish swing, measure the completed move before judging its retracement. If the selected swing is arbitrary, the resulting levels are arbitrary as well.
The visible framework uses 23.6%, 38.2%, 50%, 61.8%, and 78.6% as reference levels. These are not five independent entry signals. They organize the depth of the pullback and help identify zones where price behavior deserves closer observation.
The 50% area is treated as potential support in the long example and potential resistance in the short examples. Potential is the load-bearing word. A midpoint can attract a reaction, but it does not guarantee reversal. The 61.8% area can serve as a deeper reference for invalidation, depending on the nearby swing structure.
EMA structure establishes the directional bias
The EMA relationship helps answer whether a retracement is occurring with or against the active trend structure. In the bearish EMA example, the 9 EMA remains below the 21 EMA. That relationship supports a short bias while price retraces into resistance.
EMA alignment is context, not permission. A short entry still requires rejection near the Fibonacci zone. If price accepts above the area, holds above the relevant swing, or forces the faster EMA back above the slower EMA, the original bearish reasoning weakens.
This is why a moving-average crossover should not be treated as a precise entry trigger. Crossovers can arrive after much of the move has already developed. Their better use here is to frame directional conditions and help manage a position when the relationship changes.
RSI confirmation should show momentum turning
RSI adds a different type of evidence. In the long example, an RSI reading below 30 represents oversold pressure, but it is not an automatic buy. The stronger condition appears when RSI turns upward while support holds and price produces a reversal candle.
The short framework applies the same logic in reverse. RSI above 70 represents overbought pressure, not a guaranteed sell. A short idea becomes more credible when momentum turns down as price rejects resistance or breaks back below the Fibonacci zone.
Reading RSI this way keeps the indicator subordinate to structure. Oversold conditions can persist during aggressive selling, just as overbought conditions can persist during strong advances. The turn matters more than the label because it shows that momentum may be changing at the location already identified by the retracement.
Long and short setups use mirrored confirmation
A long setup begins with an established upward swing. Draw the retracement from swing low to swing high, then monitor the pullback around the 50% area and the deeper 61.8% reference. The setup remains incomplete until support holds, a reversal candle appears, and RSI turns upward from oversold pressure.
A short setup begins with a completed bearish swing or a broader bearish EMA structure. Monitor the retracement into the 38.2% to 50% area for resistance. Entry depends on rejection candles or a break back below the zone, while bearish EMA alignment or RSI turning down adds confirmation. The stop belongs beyond the structure that would prove the rejection failed.
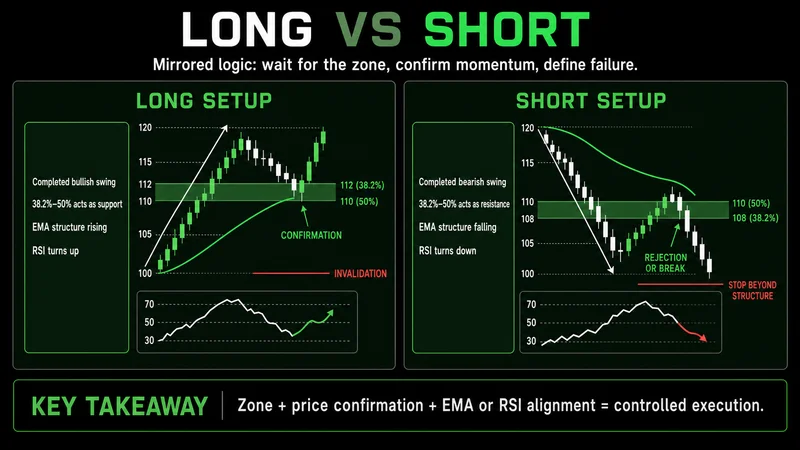 Long and short setups mirror the same process while reversing the swing direction and confirmation signals.
The two directions use the same decision process even though the chart geometry is reversed: define the swing, locate the retracement zone, observe the reaction, confirm momentum, and place invalidation beyond the structure supporting the idea.
A concrete setup begins before the entry candle
Consider a bearish swing that produces a clear high, a sustained decline, and a visible low. Price then retraces toward the 38.2% and 50% region while the 9 EMA remains below the 21 EMA. That creates a location and a directional bias, but it does not create an entry.
The trader waits. Price reaches the zone and prints a rejection candle rather than accepting above resistance. A short can be considered only after that failure is visible. Invalidation sits above the rejected resistance or the swing high. The prior swing low can provide an initial target reference, while a later 9 EMA cross above the 21 EMA can support profit management.
If price closes through resistance and holds, the idea is wrong before the stop becomes a debate. The quality of the analysis is not measured by whether the level reacts briefly. It is measured by whether the trader respects the condition that invalidates the setup.
The common mistake is treating confluence as certainty
More indicators do not eliminate uncertainty. Fibonacci, EMA, and RSI can align while price still fails to continue. The purpose of confluence is to improve decision quality and define risk, not to promise an outcome.
Another mistake is entering because RSI crossed 30 or 70 without checking price structure. A third is drawing Fibonacci across an unclear swing and then moving the anchors until a preferred level fits current price. Both actions turn analysis into confirmation bias.
Execution should remain reactive. Mark the swing and levels first. Write down the required price reaction, EMA condition, RSI behavior, and invalidation point. If one condition is missing, there is no reason to force the trade.
Defined invalidation protects the setup from interpretation
Invalidation must be attached to structure. For a long setup, the reference may sit below the 61.8% area or the local swing low. For a short setup, it may sit above the 61.8% area, rejected resistance, or the relevant swing high. The correct choice is the point where the original market logic no longer holds.
A stop placed only at a convenient distance can remain inside normal price movement. A stop placed beyond meaningful structure has a clear analytical purpose. Position size must then adapt to that distance so the account risk remains controlled.
Before execution, confirm the swing anchors, directional bias, reaction candle, momentum turn, and invalidation level. If the stop location is unclear, the setup is not ready. If price has already moved too far from the confirmation point, chasing it changes the risk and should be avoided.
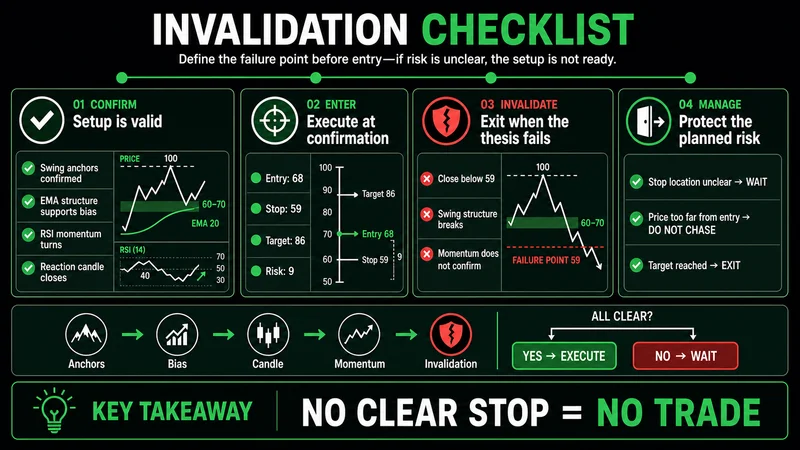 Execution begins only after the swing, reaction, momentum, and structural stop are defined.
When this framework does not work
This framework loses quality when the swing is unclear, price is ranging without directional structure, or volatility moves through several Fibonacci levels without acceptance or rejection. EMA relationships can repeatedly cross in those conditions, while RSI can rotate between extremes without producing useful continuation.
It also breaks down when a trader treats the 50% or 61.8% area as a barrier that price must respect. A zone has no authority over the market. If price accepts beyond it, the setup has failed regardless of how many indicators originally aligned.
Fast expansion can make confirmation arrive after the available reward has already contracted. In that case, passing is better than entering late with a wide stop and a nearby target. No strategy works in every condition. Adaptation includes recognizing when the framework has stopped offering defined risk.
Apply the framework as a repeatable checklist
Start with a clean chart and identify one completed swing. Draw the Fibonacci retracement in the direction appropriate to the setup. Mark the 38.2%, 50%, and 61.8% areas, then assess whether EMA structure supports a long or short bias.
Wait for price to reach the relevant zone. Look for support or resistance to hold, followed by a reversal candle or a decisive break back through the zone. Use RSI as momentum confirmation by watching for a turn away from oversold or overbought pressure. Finally, define the structural invalidation before considering position size.
The practical edge is not the drawing tool or the indicator setting. It is the discipline to demand alignment, accept invalidation, and avoid acting when the evidence remains incomplete. Fibonacci identifies the area. Price behavior decides whether the area matters.
Worth the read?