How Chevron Makes Money Through the Oil Cycle
How Chevron makes money starts with upstream profit, downstream volume, heavy costs, and cash flow whose strength depends on the oil cycle, not revenue alone.
How Chevron makes money is less about selling the most fuel and more about converting oil-linked production into durable cash flow. Chevron’s FY2025 figures show two different operating engines: downstream supplies much of the sales volume, while upstream carries more of the profit sensitivity.
That distinction matters because revenue can look stable while earnings contract. Purchased crude, operating expenses, depreciation, taxes, and interest absorb most of the top line. The remaining profit then moves with commodity prices, refining margins, production growth, and capital allocation.
How Chevron makes money across two engines
Chevron operates an integrated energy model. Upstream explores for and produces oil and natural gas. Downstream refines crude, sells fuels, and markets related products. These segments participate in different parts of the same value chain, but they do not contribute to earnings in the same way.
The FY2025 breakdown identifies roughly $72.5 billion of downstream external sales and about $45.5 billion from upstream. Downstream is the volume driver because refined products pass through the business at large dollar values. Upstream is the profit driver because the value of produced barrels can rise faster than many extraction costs when commodity prices strengthen. About $0.6 billion came from other and chemicals activities. These segment sales are not presented as a direct reconciliation to consolidated revenue, so adding them together is a common analytical error.
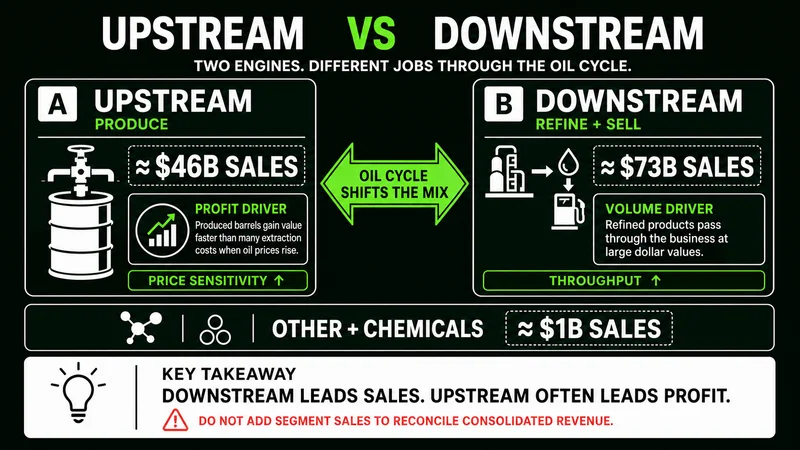 Upstream and downstream contribute differently to Chevron’s integrated business model.
Integration can soften pressure in one segment, but it does not eliminate the cycle. Lower crude prices can reduce upstream earnings while helping some refinery inputs. Wider refining spreads may support downstream results even when production economics weaken. The protection is partial because both businesses still face operating costs, maintenance requirements, and changing demand.
Chevron’s revenue breakdown becomes a narrow profit funnel
Chevron reported approximately $184.4 billion of FY2025 revenue. About $108.2 billion went toward purchased crude and products, leaving roughly $76.2 billion of gross profit. That is a gross margin near 41%, but it is only the first stage of the income statement.
Operating and selling expenses were about $33.1 billion. Depreciation, depletion, and amortization added approximately $20.1 billion, reflecting the capital-heavy asset base required to produce, transport, and refine energy. Taxes, interest, and other items accounted for roughly $10.7 billion. After those layers, operating income was about $18.1 billion, and net income was approximately $12.3 billion.
The practical lesson is that a 41% gross margin does not describe the shareholder outcome. Chevron’s operating margin was near 10%, while its net margin was approximately 6.7%. The gap is the cost of maintaining and financing a large physical system. Investors who stop at gross profit miss the expenses that determine how much value reaches the bottom line.
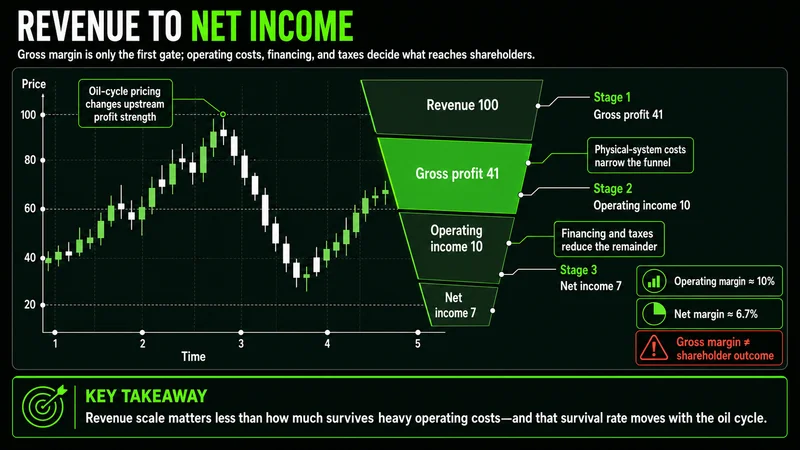 Large revenue narrows after product costs, operations, depreciation, taxes, and interest.
A concrete example makes the funnel clearer. For every illustrative $100 of revenue, about $59 is consumed by purchased crude and products based on the displayed figures. The remaining $41 must still cover labor, exploration, administration, asset depreciation, taxes, interest, and other costs. Only about $6.70 reaches net income. Small changes in selling prices or costs can therefore create a much larger percentage change in earnings.
Oil prices and execution move Chevron stock
Oil and natural gas prices are the primary swing factors because upstream earnings follow the commodity cycle. OPEC+ supply decisions, global demand, and geopolitical disruptions can change realized prices. Chevron cannot control those variables, so the quality of its response matters more than any single forecast.
Downstream refining margins provide another moving part. Crack spreads measure the economic gap between crude inputs and refined products. Wider spreads can support refinery profit; compressed spreads can remove that support. Production growth in the Permian Basin, the ramp of the TCO project, and integration associated with Hess and Guyana represent operational catalysts identified in the FY2025 overview.
Capital returns also affect how investors interpret the cycle. The dividend can provide a steadier cash-return component, while buybacks are flexible and can adjust with available cash. Operating cash flow of roughly $32 billion funded both in the period shown. That cash figure looks stronger than the reported net margin because depreciation is a non-cash income-statement charge, although the underlying assets still require real capital spending.
Chevron’s stock valuation needs normalized earnings
The FY2025 comparison placed Chevron near 32 times current earnings, versus roughly 26 times for ExxonMobil, 19 times for ConocoPhillips, and 13 times for Shell. On the surface, Chevron appears expensive. The mistake is treating those multiples as if every company were at the same point in its earnings cycle.
A price-to-earnings ratio divides price by earnings. When cyclical earnings fall, the denominator shrinks, and the multiple rises even if the stock price does not. Chevron’s displayed multiple was based on trough-of-cycle earnings, so part of the premium may be a mathematical artifact rather than a pure growth premium.
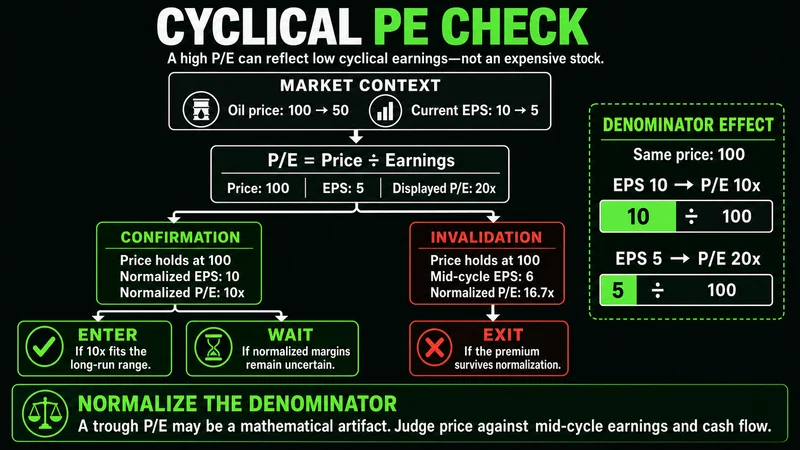 A high P/E can reflect depressed cyclical earnings, but normalization does not excuse an unsupported premium.
There are still reasons investors may accept some premium. The analysis points to balance-sheet strength, a consistent dividend record, and a 38-year dividend-growth streak. Those qualities can support confidence through weaker commodity conditions. They do not make any valuation automatically reasonable. A durable business can still be purchased at a price that leaves little room for execution problems.
The better comparison uses normalized earnings across a full commodity cycle. Estimate profit under weaker, midcycle, and stronger oil-price conditions. Then compare valuation, cash generation, capital spending, debt, dividends, and buybacks under each case. A single P/E snapshot is a starting point, not a conclusion.
The common mistake is confusing revenue with resilience
High revenue does not prove high profitability. Downstream sales carry substantial input costs, while upstream profit can contract quickly when oil and gas prices fall. The useful questions are how much cash remains after operating needs, how much must be reinvested, and whether capital returns remain covered under less favorable conditions.
A practical review can follow five checks:
- Separate upstream profit sensitivity from downstream sales volume.
- Trace revenue through purchased products, operating costs, depreciation, and taxes.
- Compare operating cash flow with dividends, buybacks, and capital spending.
- Normalize earnings before comparing P/E ratios with peers.
- Size the position for commodity volatility rather than dividend stability alone.
This approach keeps the analysis reactive, not predictive. It does not require a precise oil-price forecast. It requires defined assumptions and a clear view of what would make those assumptions wrong.
When this framework does not work
Normalized earnings are useful only when the business remains reasonably comparable across the chosen cycle. The framework becomes weaker after a major acquisition, a large asset sale, a structural change in production, or a lasting shift in capital requirements. In those cases, historical margins may describe a company that no longer exists in the same form.
Integration risk around Hess, geopolitical exposure in Kazakhstan, Venezuela, and Guyana, carbon regulation, emissions costs, and long-term demand changes can also alter the baseline. A standard midcycle estimate may understate these risks. Refining disruptions or unusually wide crack spreads can distort one period in the opposite direction.
The dividend record does not invalidate those concerns. It is evidence of past capital-return discipline, not proof that future cash coverage is fixed. This framework does not work when investors use normalized earnings to smooth away a genuine deterioration in assets, costs, or demand.
Defined invalidation keeps the valuation honest
The constructive case is invalidated if normalized cash flow cannot cover necessary capital spending and the dividend without sustained balance-sheet pressure. It also weakens if promised production growth fails to offset declining assets, acquisition benefits do not materialize, or management maintains aggressive buybacks while underlying cash generation deteriorates.
For the valuation case, the key invalidation is simpler: if Chevron still trades at a large peer premium after earnings recover to a defensible midcycle level, then low trough earnings no longer explain the gap. The premium must be justified by stronger growth, safer cash flows, or better capital returns. Without that evidence, the stock can remain overvalued even if the company stays profitable.
Chevron is profitable, but the cycle sets the terms
Chevron’s model combines upstream profit exposure, downstream volume, and substantial capital requirements. FY2025 revenue produced positive margins and strong operating cash flow, but the income statement also showed how quickly large sales narrow into a smaller net result.
The disciplined conclusion is conditional. Chevron may deserve a quality premium for its balance sheet and dividend history, yet its apparent P/E premium cannot be judged without normalizing cyclical earnings. Oil prices, refining margins, project execution, and capital allocation will decide whether that premium reflects resilience or leaves too little room for risk.
Worth the read?