What Drives Applied Materials Stock — A Practical Guide
Learn what drives Applied Materials stock through revenue mix, AI equipment demand, margins, cycle risks, China policy, and peer valuation.

what drives Applied Materials stock is the interaction between semiconductor-equipment spending, AI-related demand, earnings quality, and the valuation investors assign to those earnings. The business can remain highly profitable while the stock falls if expectations, capital spending, or China policy shifts against it.
That distinction is the foundation of the analysis. Applied Materials may be a strong business, but the stock reflects what the market expects next. Revenue explains the operation. Margins show its quality. Catalysts and risks determine the earnings path. Valuation decides how much optimism is already embedded in the price.
What drives Applied Materials stock beyond the headline
Applied Materials sells equipment and services used in semiconductor manufacturing. Its largest disclosed business is Semiconductor Systems, which generated about $20.8 billion and represented roughly 73% of the $28.37 billion revenue shown in the source material. Applied Global Services contributed about $6.39 billion, while Display added about $1.06 billion.
This mix matters because the segments behave differently. Systems revenue benefits when chip manufacturers build or upgrade fabrication capacity. Services can be steadier because installed equipment requires support, maintenance, and subscriptions. Display is smaller and does not carry the same influence over the total result.
The practical principle is simple: do not treat every revenue dollar as equally durable. Equipment orders can move sharply with capital-spending cycles. Recurring service revenue can soften that volatility, but it does not eliminate exposure to the semiconductor cycle.
The revenue engine starts with fabrication spending
The operating chain runs from customer capital budgets to equipment orders, tool deliveries, fabrication capacity, and recognized revenue. A large foundry or memory producer does not increase spending merely because chip demand sounds strong. It spends when expected utilization, process transitions, and future returns justify additional capacity.
That makes wafer-fabrication-equipment spending, or WFE, a central signal. Rising WFE can support order growth across leading-edge logic, high-bandwidth memory, and advanced manufacturing. Falling WFE can delay purchases even when the long-term semiconductor thesis remains intact.
The common mistake is to begin with a popular end market and skip the spending chain. AI demand may be real, but Applied Materials earns revenue when that demand becomes customer budgets and equipment orders. The confirmation is not the narrative alone. It is improving capital expenditure, orders, guidance, and revenue conversion.
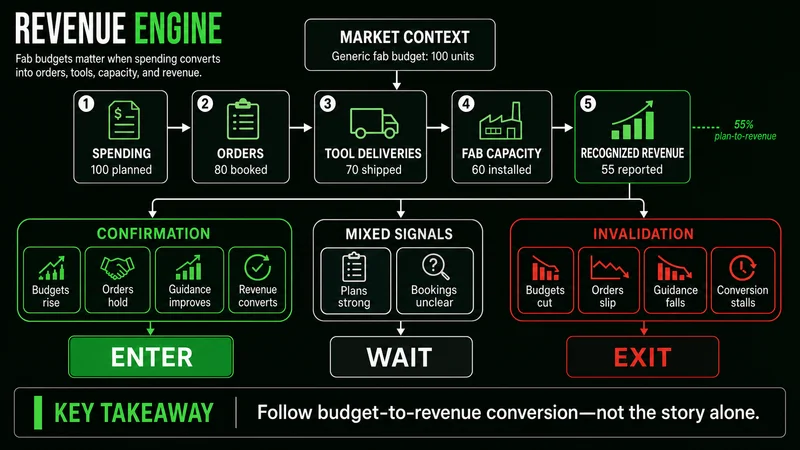 End-market demand matters only after it becomes capital spending, equipment orders, and recognized revenue.
AI demand matters when it reaches equipment orders
The strongest catalyst in the supplied material is AI-driven leading-edge demand. Data-center investment can increase demand for advanced logic and memory, including HBM and DRAM. That can encourage foundries and memory producers to add or improve manufacturing capacity.
The sequence deserves discipline:
- AI infrastructure demand increases.
- Chip designers and data-center suppliers require more advanced components.
- Foundries and memory manufacturers approve capital spending.
- Equipment orders rise.
- Deliveries and acceptance convert those orders into revenue.
Each step introduces timing risk. Strong AI spending does not guarantee immediate equipment revenue, and equipment orders do not always convert within the quarter investors expect. Quarterly guidance therefore matters because it tests whether the long-term theme is reaching the income statement.
A useful confirmation framework is to watch WFE direction, the AI-related product mix, memory pricing, foundry spending, and guidance relative to expectations. A bullish thesis is stronger when several of those signals improve together. It is weaker when the stock rises on AI enthusiasm while customer spending or guidance remains flat.
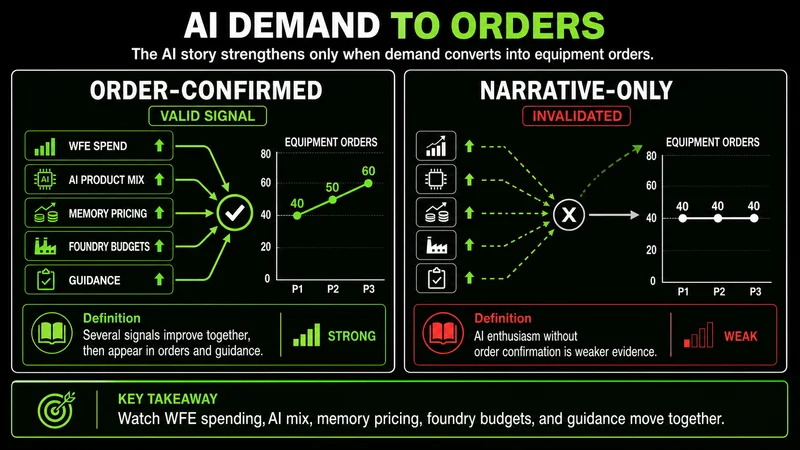 AI demand becomes relevant to equipment earnings when customers approve capital spending and place orders.
High margins show quality, not immunity
The displayed income statement shows gross profit of about $13.81 billion, equal to a 48.7% gross margin. Operating income was about $8.29 billion, or 29.2% of revenue. Net income was approximately $7.0 billion, producing a 24.7% net margin.
Those are substantial margins for an equipment business. They indicate pricing power, technical value, scale, and a profitable service contribution. Applied Global Services also adds a recurring element that can make the earnings profile more resilient than equipment revenue alone suggests.
Still, high margins are not a complete stock thesis. The source material describes the business as high margin but cyclical. If equipment demand contracts, lower revenue can pressure operating leverage. A stable service stream may cushion the decline, but it cannot fully offset a broad reduction in fabrication spending.
Strong margins describe the quality of current earnings. The spending cycle determines how much of that quality the market can carry forward.
The practical check is margin direction, not one isolated margin level. Stable gross margin during softer demand suggests resilience. Falling gross and operating margins alongside weaker orders would challenge the claim that earnings quality is holding.
Cyclicality and China policy define the bear case
The central risks are not hidden. WFE spending is deeply cyclical. Periods of expansion can produce excess capacity, which leads customers to cut or delay purchases. Memory demand can also change quickly as DRAM and NAND pricing moves through its cycle.
China adds a separate policy risk. The source material identifies China sales exposure and tightening export controls as major variables. A rule change can restrict which tools may be sold, alter the regional revenue mix, or force investors to reduce their earnings estimates. This risk can change faster than the physical semiconductor cycle.
Customer concentration also matters. A limited group of large foundries and chip manufacturers controls substantial capital budgets. When one major customer changes a project schedule, the effect can be visible in orders and guidance. Competition from Lam Research, KLA, ASML, and Tokyo Electron adds pressure across specialized equipment categories.
A defined invalidation keeps the analysis honest. The constructive thesis weakens if WFE expectations roll over, AI-related spending fails to become orders, memory recovery stalls, export restrictions reduce accessible demand, and guidance deteriorates. One soft quarter may be timing. Several aligned failures indicate a change in the earnings path.
 The constructive thesis weakens when several operating and policy risks deteriorate together.
Valuation can invalidate a correct business thesis
The supplied comparison places Applied Materials near 46 times next-twelve-month earnings, versus roughly 60 times for Lam Research, 66 times for ASML, and 72 times for KLA. On that peer snapshot, Applied Materials trades at the lowest multiple in the group. It can therefore look relatively inexpensive while remaining elevated against its own history.
That is the valuation tension. Bulls can argue that AI-era equipment demand and recurring service revenue deserve a premium. Bears can agree that the company is strong while arguing that cyclical downside is not adequately reflected in the multiple.
| Valuation question | Constructive reading | Risk reading |
|---|---|---|
| Lower P/E than peers | Relative discount | Peers may also be expensive |
| Premium to company history | Better growth mix | Expectations may be crowded |
| Strong current margins | Earnings quality | Margins remain cycle-sensitive |
| AI capital spending | Multi-year demand | Orders may arrive later than expected |
The common mistake is to call a stock cheap solely because its P/E is below peer averages. Relative valuation is only one reference point. A lower multiple may offer room for upside, or it may reflect different growth expectations, product exposure, and policy risk.
A practical framework separates evidence from expectations
Start with the income statement, then move outward. Revenue mix identifies the economic engine. Margin trends reveal earnings quality. Industry spending and guidance test the next phase. Valuation shows the price attached to that outlook.
A disciplined review can use five questions:
- Is WFE spending expanding, stable, or contracting?
- Is AI demand becoming foundry and memory capital expenditure?
- Are gross and operating margins holding as revenue changes?
- Is China policy reducing the accessible market or changing the sales mix?
- Does the valuation leave room for execution risk?
Consider a concrete example. Suppose AI infrastructure spending remains strong and memory pricing recovers. That is constructive, but confirmation still requires manufacturers to increase capital budgets. If orders and guidance then improve while margins remain stable, the operating evidence supports the narrative. If the P/E has already expanded far ahead of those results, the business thesis can be right while the entry remains poorly defined.
The better decision is reactive, not predictive. Require evidence from spending, orders, guidance, and margins. Then compare that evidence with the expectations implied by the multiple. Defined invalidation matters more than confidence in a broad technology theme.
When this framework does not work cleanly
This framework loses precision around sudden policy announcements, abrupt customer schedule changes, and early-cycle turns. Export rules can alter accessible demand before reported results show the effect. Large orders can shift between quarters, making one period look stronger or weaker than the underlying trend.
It also works poorly when peer P/E figures use inconsistent earnings estimates or measurement dates. In that case, the comparison creates false precision. Use the displayed multiples as a snapshot, not a permanent fair-value range. Confirmation must come from a consistent earnings basis and updated operating evidence.
FAQs
How does Applied Materials make most of its money? Semiconductor Systems is the primary revenue engine, contributing about $20.8 billion, or roughly 73% of the displayed total. Applied Global Services adds a smaller but more recurring stream.
Why is AI important to Applied Materials? AI infrastructure can increase demand for advanced logic and high-performance memory. The effect reaches Applied Materials when chip manufacturers convert that demand into fabrication spending and equipment orders.
Is Applied Materials profitable? The supplied figures show a 48.7% gross margin, a 29.2% operating margin, and a 24.7% net margin. These figures indicate strong profitability, although the equipment cycle can still influence future earnings.
Is Applied Materials overvalued? The displayed 46-times forward P/E is below the peer multiples shown but elevated against the company’s own history. Whether that valuation is justified depends on AI-related order conversion, WFE conditions, margins, China exposure, and guidance.
Worth the read?