How Does Lam Research Make Money — and Is It Overvalued?
How does Lam Research make money? Its tools, service revenue, strong margins, cyclical exposure, and valuation reveal the full investment case.
How does Lam Research make money? It sells the systems used to manufacture semiconductors, then supports that installed base with service, spare parts, and other recurring work. In fiscal 2025, that model produced $18.4 billion in revenue, a 49% gross margin, and $5.4 billion in net income.
Those numbers explain the quality of the business. They do not settle the valuation question. Lam Research remains tied to wafer-fabrication-equipment spending, memory investment, export controls, and customer budgets. When expectations rise toward a roughly 70-times earnings multiple, good execution is no longer enough. The cycle must also cooperate.
How does Lam Research make money across two revenue streams?
Systems are the main engine. The fiscal 2025 breakdown assigns about $11.5 billion, or 62% of sales, to semiconductor-manufacturing systems. These tools perform critical fabrication steps, including etch and deposition. Demand rises when memory producers and leading foundries expand capacity, introduce more complex processes, or upgrade existing production lines.
Customer support and other revenue contributed about $6.95 billion, or 38% of sales. This side includes service and spare-parts activity tied to equipment already operating in fabrication plants. It gives Lam a second way to earn: first from installing a tool, then from helping customers maintain and use that installed base. The support stream can cushion the business when new-equipment orders slow, although it cannot fully remove the cycle.
The practical distinction is simple. Systems revenue captures capital spending today. Support revenue monetizes tools placed in prior years. A useful analysis keeps those streams separate because they carry different timing, demand drivers, and resilience.
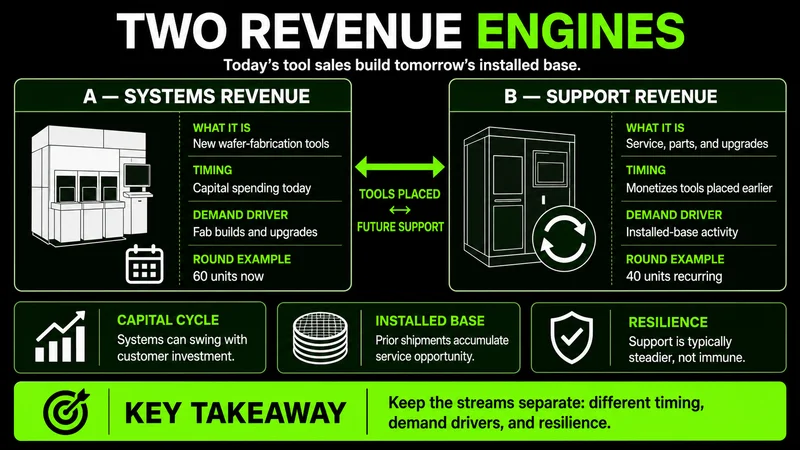 Current equipment spending drives systems sales, while the installed base supports recurring service activity.
Lam Research margins show where the model earns its quality
From $18.4 billion of fiscal 2025 revenue, approximately $9.5 billion left through cost of revenue. That produced roughly $9.0 billion of gross profit and a 49% gross margin. The company then spent about $2.1 billion on research and development and around $1.0 billion on selling, general, and administrative expenses.
What remained was approximately $5.9 billion of operating income, equal to a 32% operating margin. After about $0.5 billion attributed to taxes and other items, net income reached roughly $5.4 billion. Put differently, about $0.29 of every revenue dollar became net income.
The quality signal is not revenue alone. It is Lam’s ability to hold substantial gross margin while funding new etch and deposition technology, keeping overhead controlled, and converting sales into cash-generating earnings power. The slide set also shows operating margin recovering from about 22% in 2024 to 32% in 2025 as memory demand improved.
That improvement requires context. A rising margin during a recovery can reflect stronger volume, favorable product mix, and better factory utilization. It should not automatically be treated as a permanent baseline.
The wafer-fab-equipment cycle moves the stock most
The most important driver is the wafer-fab-equipment, or WFE, capital-spending cycle. Lam’s customers make large, uneven investment decisions. When memory producers, foundries, and logic manufacturers increase budgets, tool demand can rise quickly. When inventories build or end demand cools, those budgets can be cut.
AI and data-center investment add a powerful catalyst because advanced memory, including high-bandwidth memory and advanced DRAM, requires additional process complexity. A NAND recovery can also increase demand for etch and deposition tools. Spending by major foundry and logic customers provides another path for growth.
The concrete setup is a synchronized upcycle: memory demand improves, WFE budgets rise, orders strengthen, revenue expands, and margins benefit from higher activity. Investors may then pay a higher multiple because earnings estimates are also moving higher. The inverse sequence matters just as much. If budgets roll over, earnings expectations and the valuation multiple can contract together.
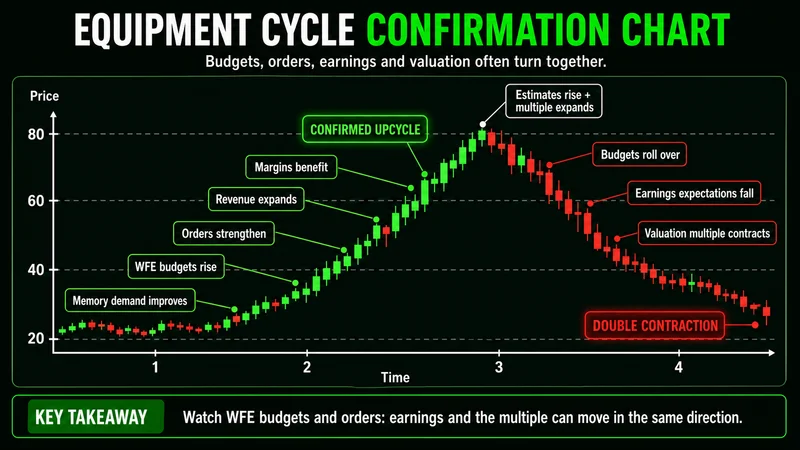 Equipment budgets transmit through orders and earnings before changing the valuation investors will pay.
This is why reacting to an AI headline without checking the capital cycle is a common mistake. AI can strengthen demand, but Lam still sells into a cyclical equipment market. The better confirmation comes from order trends, WFE budgets, gross-margin guidance, and evidence that memory spending is translating into actual tool demand.
The main risks can break an otherwise strong thesis
The first risk is cyclicality. Semiconductor manufacturers can move from shortage to excess capacity, and equipment spending can fall before reported revenue fully reflects the change. A strong trailing year may therefore describe the late stage of an upcycle rather than the next year’s earnings power.
Customer concentration creates a second risk. Lam depends heavily on memory producers and large foundry customers. A budget reduction at a small number of buyers can matter more than broad semiconductor demand suggests.
China exposure and export-control rules add policy risk. Restrictions can change which systems may be sold, where revenue can be earned, and how customers plan future capacity. This risk does not require the entire business to weaken. A change in geographic mix can pressure growth even while demand elsewhere remains healthy.
Competition also matters. Applied Materials, KLA, and other equipment suppliers compete for customer budgets, while different process technologies can redirect spending. Lam’s strong profitability does not make competitive pressure irrelevant.
Finally, margin pressure can appear if NAND or DRAM capital spending rolls over. Lower system volume can reduce operating efficiency, while the more resilient support business may be too small to offset the decline completely.
Is Lam Research overvalued near a 70-times P/E?
The supplied comparison places Lam near 70 times next-12-month earnings, against roughly 72 times for KLA, 66 times for ASML, and 46 times for Applied Materials. It also places Lam’s multiple well above an indicated 10-year median near 20 times. Another reference on the slide shows a forward multiple around 50 times if earnings continue climbing.
These figures describe two different questions. Relative valuation asks whether Lam is expensive compared with peers that also benefited from AI-related re-rating. Historical valuation asks whether the entire group is trading at unusually high expectations compared with its own past.
Lam may look broadly aligned with KLA and ASML while still being expensive in absolute and historical terms. The premium assumes that AI memory demand, recurring support revenue, and the WFE upcycle will sustain earnings growth. The lower forward figure also depends on the denominator rising. If earnings estimates stop climbing, that apparent valuation relief may never arrive.
The common mistake is treating P/E as a static price tag. In a cyclical company, both price and expected earnings move. A 70-times multiple can become cheaper through rapid earnings growth, but it can also become more expensive if estimates fall before the share price adjusts.
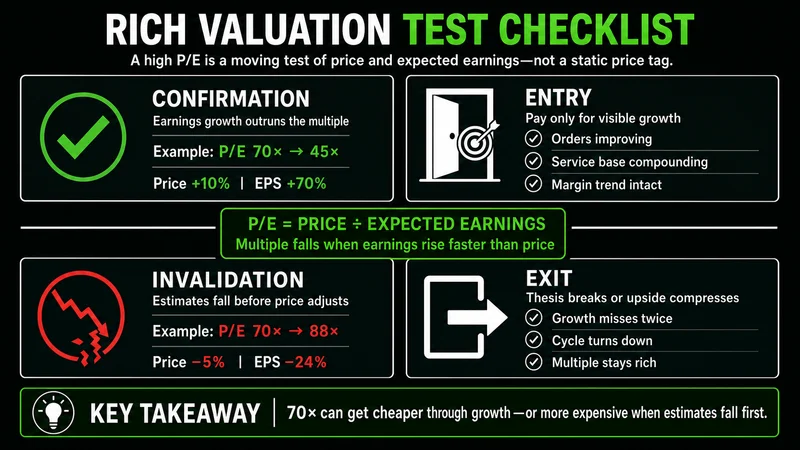 A high multiple holds only while earnings growth and cycle confirmation remain aligned.
MRPNL principle: A rich multiple needs rising earnings and cycle support.
A disciplined review separates confirmation from narrative
A practical review starts with the revenue model, then tests the cycle and valuation. First, track whether systems and customer-support revenue are both advancing. Systems reveal current capital spending, while support shows the strength of the installed base.
Next, compare order trends and WFE budgets with management’s gross-margin direction. Rising orders without margin support may indicate a weaker mix or higher costs. Strong margins without durable orders may describe a temporary peak. The higher-quality setup has improving demand and stable execution at the same time.
Then test the valuation against more than one frame:
- Compare Lam with KLA, ASML, and Applied Materials.
- Compare the current multiple with Lam’s longer historical range.
- Check whether forward earnings growth is doing the work required to reduce the multiple.
- Watch memory budgets, China exposure, and customer concentration for evidence against the thesis.
Defined invalidation matters. The bullish case weakens if memory and WFE budgets roll over, orders deteriorate, gross-margin guidance falls, and earnings estimates stop rising while the valuation remains elevated. One weak data point may be noise. Several aligned negatives change the structure of the case.
When this framework does not work cleanly
This framework is less useful during abrupt policy changes or sharp semiconductor supply disruptions. Export rules can alter accessible demand before ordinary cycle indicators respond. A customer can also cut a large project for company-specific reasons, making broad WFE data look healthier than Lam’s actual order book.
It also breaks down when valuation inputs use inconsistent periods. Trailing P/E, next-12-month P/E, and a forward multiple based on later estimates are not interchangeable. Comparing them without matching the earnings window can create a false discount or premium.
The response is not to predict perfectly. It is to define what evidence would confirm the thesis and what would invalidate it. Lam’s fiscal 2025 income statement shows a highly profitable semiconductor-equipment business with a meaningful support stream. Its stock case remains more demanding: investors are paying for the cycle to continue, earnings to rise, and execution to stay disciplined.
The business is strong, but the price needs support
Lam Research makes money through critical chip-fabrication systems and the service activity attached to its installed base. Fiscal 2025 showed strong conversion from revenue to operating and net income. AI memory, NAND recovery, and foundry spending can extend that performance.
The valuation leaves less room for disappointment. The disciplined conclusion is not that a high P/E automatically makes Lam uninvestable. It is that the multiple requires continued confirmation from orders, budgets, margins, and earnings. If those supports weaken together, the investment case changes before the business stops looking profitable.
Worth the read?