How Nvidia Makes Money and Tests Its Valuation
How Nvidia makes money starts with Data Center demand, but its valuation depends on margins, durable growth, and the risks embedded in expectations.

How Nvidia makes money is straightforward at the top line but harder to judge at the stock level. The business is powered by Data Center sales, then amplified by unusually high margins. The valuation question depends on whether that revenue concentration remains a durable advantage or becomes the source of the next earnings disappointment.
The useful principle is simple: separate business quality from valuation. Revenue mix explains where demand originates. Margins show how efficiently that demand becomes profit. The earnings multiple shows what the market already expects. A strong company can still be a weak purchase if expectations leave no room for execution risk.
How Nvidia makes money through Data Center demand
Nvidia generated $215.9 billion in FY2026 revenue. Data Center contributed $193.7 billion, or roughly 90% of the total. Gaming produced $16.0 billion, Professional Visualization contributed $3.2 billion, Automotive and Robotics added $2.3 billion, and OEM and Other supplied about $0.7 billion. Those smaller segments matter, but they do not currently drive the income statement.
The revenue map therefore has one dominant channel. Demand for AI computing infrastructure flows through Data Center products, while the other segments provide limited diversification. Investors should read the company as an AI infrastructure business with several smaller operations, not as a balanced collection of equal revenue engines.
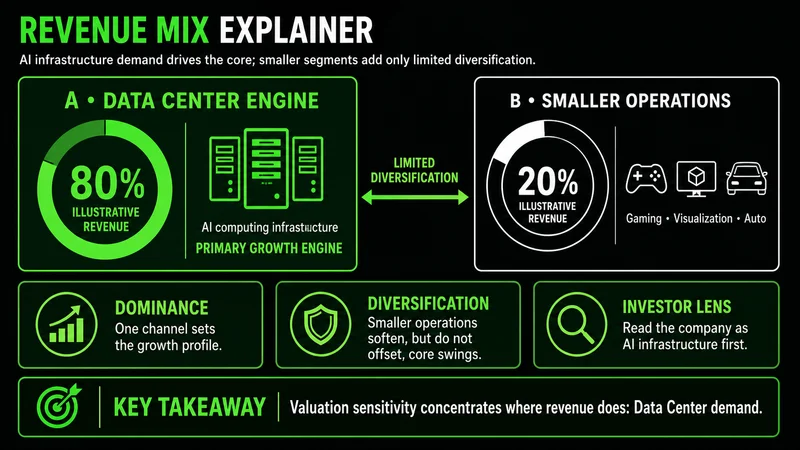 One segment supplies most of the revenue, leaving smaller businesses with limited offsetting power.
This concentration explains why the market watches Data Center revenue so closely. Quarterly guidance, new product cycles, hyperscaler capital spending, and manufacturing capacity can change expectations quickly because they all influence the largest source of sales. A modest change in a minor segment cannot offset a material slowdown in a division representing about nine-tenths of revenue.
A concrete example makes the sensitivity clear. If Data Center demand stays firm while Gaming pauses, the main earnings engine remains intact. If Data Center growth misses expectations, strength in Professional Visualization or Automotive and Robotics is unlikely to close the gap at their current scale. The stock may react more to the composition of revenue than to the headline total.
High margins turn revenue into substantial earnings
The FY2026 income statement shows $62.5 billion in cost of revenue against $215.9 billion in sales, leaving $153.5 billion in gross profit. That is a gross margin near 71%. After $18.5 billion in research and development and $4.6 billion in selling, general, and administrative expense, operating income reached $130.4 billion, or about 60% of revenue. Net income was $120.1 billion, close to a 56% net margin.
These figures explain why investors assign significant value to the business. Nvidia is selling hardware, but the economics resemble a high-margin platform more than a conventional low-margin hardware manufacturer. A large share of each additional revenue dollar survives the gross-profit line, giving the company room to fund research, support new product cycles, and produce substantial free cash flow.
The quality of growth is visible in what remains after the sale, not only in how quickly the top line expands.
The common mistake is to focus on revenue growth without tracking the margin path. Growth created through discounting, rising production costs, or heavier operating expenses can look strong while earnings quality weakens. Here, the current case rests on both scale and conversion: large Data Center revenue is reaching operating and net income at exceptional rates.
That relationship also defines an early warning. A slowing gross margin can signal pricing pressure, a less favorable product mix, higher supply costs, or stronger competition before the revenue headline fully reflects the change. Investors should compare revenue growth with gross-margin and operating-margin direction rather than treating each metric in isolation.
The stock follows expectations as much as results
The stock can respond to several operating signals: earnings, guidance relative to estimates, product launches, hyperscaler capital spending, export-control developments, and supply capacity. These variables matter because the market prices future cash flows before they appear in reported results.
A strong quarter does not automatically produce a positive reaction. If expectations were even stronger, an earnings beat can still disappoint. Conversely, a modest near-term result may be absorbed if guidance confirms that Data Center demand, product ramps, and customer spending remain intact. Price behavior is reactive to the difference between reported performance and the performance already embedded in valuation.
This is where execution discipline matters for investors. The relevant question is not whether a headline sounds positive. It is whether the new information improves or weakens the revenue, margin, and risk assumptions behind the position. That distinction prevents a trader or investor from chasing a move after the market has already repriced the news.
Nvidia's risks are concentrated around the same growth engine
The bull case centers on continued AI infrastructure spending, expanding model demand, new chip cycles, and sustained Data Center growth. The risk case is the reverse side of that concentration. A small group of hyperscale customers drives a large share of demand, which exposes results to their capital-spending cycles and purchasing decisions.
The practical risk checklist includes slower AI capital spending, competition from alternative chips and custom silicon, export restrictions that limit addressable markets, manufacturing-capacity constraints, cyclical semiconductor demand, and a valuation that provides little room for a miss. These risks can interact. A delayed product ramp during a softer spending cycle would matter more than either issue in isolation.
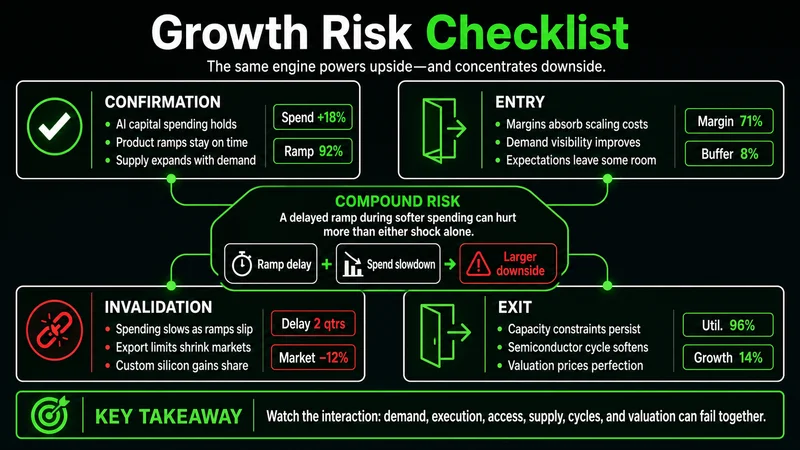 The same concentrated engine that supports rapid growth also concentrates downside risk.
Customer concentration deserves particular attention. Large buyers can support rapid growth when their budgets expand, but concentrated demand can reverse faster than a broad base of independent customers. Supply dependence adds another layer because strong end demand does not become revenue unless enough advanced products can be manufactured and delivered.
Defined invalidation should be tied to the thesis, not to a vague feeling about price. The current quality case weakens if Data Center growth decelerates materially, gross margin contracts without a temporary operational explanation, hyperscaler spending rolls over, or competitive products take enough demand to pressure pricing. One soft quarter is not automatically decisive, but several aligned deterioration signals would invalidate the assumption that exceptional economics are durable.
Is Nvidia overvalued at a lower peer multiple
The supplied forward price-to-earnings comparison places Nvidia near 31 times earnings, versus about 175 times for AMD, 65 times for Broadcom, and 41 times for TSMC. On that snapshot, Nvidia carries the lowest multiple in the peer group despite reported revenue growth of 65% and substantially higher margins than a typical hardware business.
That comparison argues against calling the stock overvalued solely because it is associated with AI enthusiasm. Relative valuation says the market is paying less for each unit of Nvidia's expected earnings than for the earnings of those selected peers. It does not prove the stock is cheap. Different businesses have different growth durability, capital requirements, customer exposure, and earnings sensitivity.
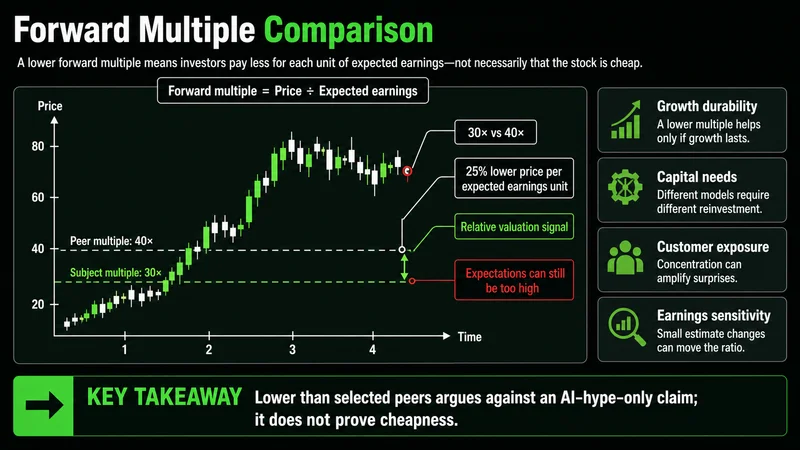 A lower peer multiple can support the valuation case, but only if forward earnings remain durable.
The correct interpretation is conditional. A 31-times multiple can be reasonable if Data Center growth remains strong, margins stay near current levels, and product execution supports future earnings. The same multiple can become expensive quickly if growth slows because the denominator in the ratio is based on forward earnings. Valuation compresses when investors reduce both earnings estimates and the multiple they are willing to pay.
A useful concrete test is to frame two cases. In the durable-growth case, revenue continues expanding, gross margin remains resilient, and earnings grow into the valuation. In the disappointment case, capital spending cools, margins decline, and forward estimates fall. The listed multiple may appear moderate before the estimate cuts, then look much less attractive after them.
When this framework does not work cleanly
This framework is less reliable during abrupt policy changes, supply disruptions, or product transitions because reported financials lag the event changing the outlook. It also loses precision when peer multiples are measured with inconsistent earnings estimates or when one company's earnings are temporarily depressed. A simple P/E comparison cannot normalize every difference in business mix and cycle position.
The framework also does not produce a precise entry price. Financial quality can remain intact while the stock experiences a sharp valuation reset. During high-volatility conditions, price may react to positioning, liquidity, and expectations faster than a quarterly model can adjust. Fundamental analysis defines the operating thesis; it does not remove timing risk.
A practical review process keeps the thesis measurable
Start with Data Center revenue because it is the primary engine. Then check gross margin, operating margin, and net margin to see whether growth is converting into earnings. Compare guidance with expectations, monitor hyperscaler capital spending and product cycles, and treat export policy and supply capacity as direct inputs to the model.
Finally, evaluate the forward P/E against expected earnings durability rather than against the company's reputation. The practical application is a repeatable sequence: revenue mix, margin conversion, growth drivers, risk signals, valuation, and invalidation. If several inputs weaken together, reduce confidence before the headline narrative changes.
FAQs
How does Nvidia make most of its money? Data Center generated $193.7 billion of FY2026 revenue, roughly 90% of the $215.9 billion total. The remaining segments were much smaller contributors.
Why are Nvidia's margins important? A gross margin near 71%, operating margin near 60%, and net margin near 56% show that a large share of revenue converts into profit. Margin deterioration would weaken that quality signal.
Is Nvidia overvalued based on its forward P/E? The supplied comparison places Nvidia near 31 times forward earnings, below AMD, Broadcom, and TSMC. That relative discount is constructive, but the valuation still depends on future Data Center growth, margins, and execution.
Worth the read?