GE Aerospace Aftermarket Services Business Model Explained
GE Aerospace aftermarket services business model converts engine sales into recurring revenue, strong margins, and premium valuation with execution risk.

The GE Aerospace aftermarket services business model turns an installed engine base into recurring maintenance demand. The engine sale starts the relationship, but services produce most of the revenue and support stronger margins over time. That is the core economic principle behind GE Aerospace’s FY2025 results.
The contrarian point is simple: aircraft deliveries attract attention, but the aftermarket determines the quality and durability of the earnings. Equipment growth matters because it expands the installed base. The financial value appears later, through shop visits, parts, repairs, and long-duration service activity.
GE Aerospace aftermarket services business model explained
GE Aerospace follows a razor-and-blade model. It sells engines into commercial aviation and then earns recurring revenue as those engines require maintenance throughout their operating lives. The original equipment is the razor. Replacement parts, repair work, and service visits are the blades.
FY2025 makes the difference visible. Services revenue was $30.2 billion, compared with $12.2 billion from equipment. Services were roughly two and a half times equipment revenue. That mix matters because an engine already operating in an airline fleet can create repeated aftermarket demand without requiring GE Aerospace to win a new engine sale each time.
The relationship also works in sequence. Equipment deliveries add engines to the installed base. Flight activity creates wear. Wear leads to inspections, parts demand, and shop visits. Those events produce service revenue. If execution remains controlled, the recurring work supports margin expansion and cash generation.
This is why the business cannot be judged only by annual engine deliveries. A delivery can carry lower near-term economics while establishing a service relationship that lasts for years. The value of the sale depends on utilization, maintenance timing, contract terms, and GE Aerospace’s ability to execute the work efficiently.
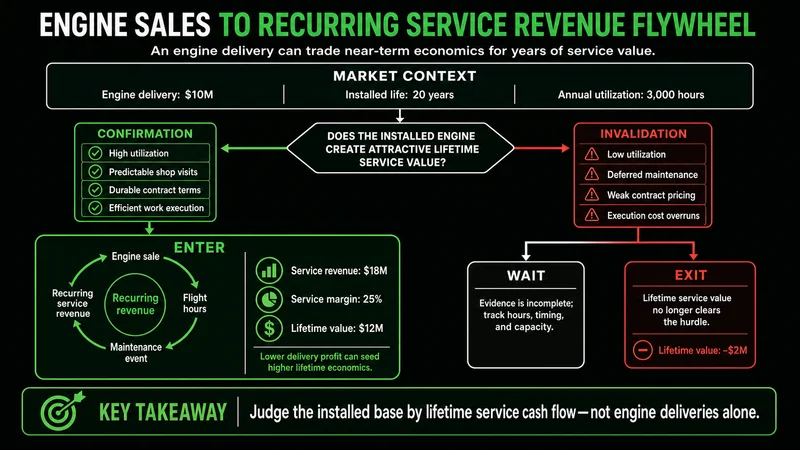 The engine sale begins a longer cycle of utilization, maintenance, parts, and service revenue.
FY2025 revenue becomes profit through service mix
GE Aerospace reported $45.9 billion in FY2025 revenue. The carousel divides that revenue among $33.3 billion from Commercial Engines & Services, $10.6 billion from Defense & Propulsion Technologies, and $2.0 billion from Corporate and Insurance activities.
Cost of sales was $29.0 billion, leaving $16.9 billion of gross profit and a 36.8% gross margin. Segment operating profit was $10.2 billion, equal to a 22.1% margin. Net income reached $8.7 billion, or 19.0% of revenue. The sequence shows substantial profit retention from the top line to the bottom line.
| FY2025 measure | Amount | Margin or share |
|---|---|---|
| Revenue | $45.9B | 100.0% |
| Cost of sales | $29.0B | 63.2% of revenue |
| Gross profit | $16.9B | 36.8% |
| Segment operating profit | $10.2B | 22.1% |
| Net income | $8.7B | 19.0% |
The numbers do not prove that every service dollar earns the same margin. They do show why mix deserves attention. When higher-margin aftermarket activity becomes a larger part of revenue, more of each sales dollar can remain after operating costs. If equipment grows faster while service demand lags, the opposite pressure can appear.
A concrete way to read the funnel is to begin with $100 of revenue. At the reported margins, about $36.80 remains as gross profit, $22.10 as segment operating profit, and $19.00 as net income. This is not a forecast. It is a scaled representation of the FY2025 income statement that makes the economics easier to compare.
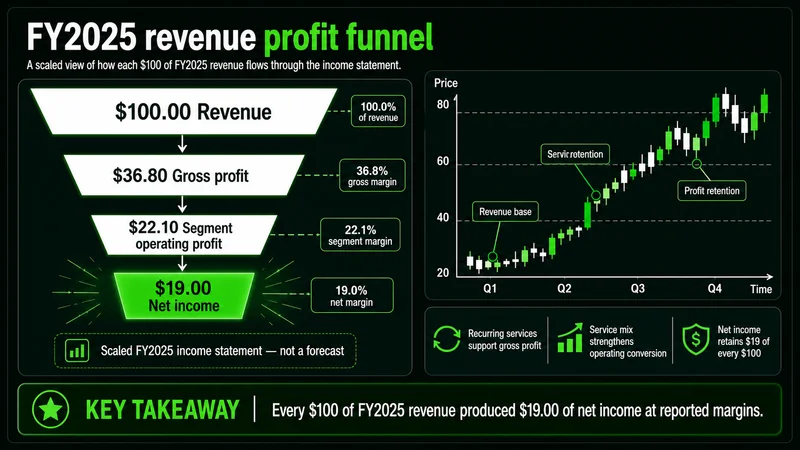 A $100 revenue example shows how FY2025 sales flowed through gross, operating, and net profit.
Three operating signals can move the stock
The first signal is aftermarket demand, especially shop-visit volume. More engines entering maintenance can support parts and service revenue. The timing is uneven, however. A deferred visit can shift revenue between periods even when long-term demand remains intact.
The second signal is the delivery ramp for LEAP engines. Higher deliveries can increase equipment revenue and expand the future service base. They can also create near-term execution pressure. Production delays, supplier constraints, or inefficient ramp costs can weaken the economics before the aftermarket benefit arrives.
The third signal is margin expansion and FY2026 guidance. At a premium valuation, investors are paying for continued operating progress. Guidance therefore matters as a test of whether service growth, delivery execution, and cost control are developing together.
Orders provide another measure of demand. The carousel reports $66.2 billion of orders, up 32%. A larger order book supports the growth case, but orders are not current profit. They must become deliveries, and deliveries must eventually produce revenue at acceptable margins.
MRPNL principle: A premium multiple is an operating demand, not a compliment.
That distinction keeps the analysis grounded. Strong demand can coexist with weak execution. A growing installed base can coexist with delayed shop visits. The stock responds to the gap between expectations and delivered results, not to the quality of the narrative alone.
The common valuation mistake is ignoring expectations
GE Aerospace traded at roughly 48 times trailing earnings in the supplied comparison, versus about 33 times for RTX. The market may assign the premium because it expects recurring service profit, margin expansion, and sustained aerospace demand. The mistake is treating that premium as proof that the stock must continue higher.
A high-quality business and an attractive entry price are different questions. At roughly 48 times trailing earnings, there is less room for execution errors. Results can remain profitable while the stock struggles if growth slows, guidance weakens, or the market reduces the multiple it is willing to pay.
The reverse mistake is assuming that a high multiple automatically makes the stock overvalued. A simple peer comparison does not adjust for different growth rates, business mixes, margins, or risk. The useful question is whether GE Aerospace can deliver enough durable profit growth to justify the valuation gap.
When the aftermarket thesis does not work
The framework weakens when the installed base stops translating into profitable service activity. That can happen if air-travel demand cools, shop visits are deferred, supply constraints delay repairs, or service costs rise faster than revenue. The same installed base then produces less near-term economic value than expected.
It also breaks down when the equipment ramp consumes more resources than the eventual aftermarket opportunity can justify. More deliveries are not automatically better if production inefficiency, supplier problems, or unfavorable economics reduce profit quality.
The valuation thesis has a separate failure condition. If margins stop expanding while the stock retains a premium multiple, the expected return becomes increasingly dependent on sentiment. Defined invalidation is a sustained combination of weaker aftermarket demand, failed delivery execution, and margin compression that contradicts management’s growth case. One soft quarter may be timing. A repeated pattern is structural evidence.
This is the grounded risk case: a strong franchise can still be a weak investment when expectations require near-perfect execution. Cyclical air-travel demand, supply-chain performance, engine-delivery execution, and valuation compression all matter because the current price already reflects confidence in future service profits.
A practical GE Aerospace stock analysis checklist
An investor can separate business quality from stock expectations by reviewing the same operating sequence each period: installed-base growth, aftermarket activity, equipment deliveries, margins, guidance, and valuation. The sequence matters because no single metric confirms the full thesis.
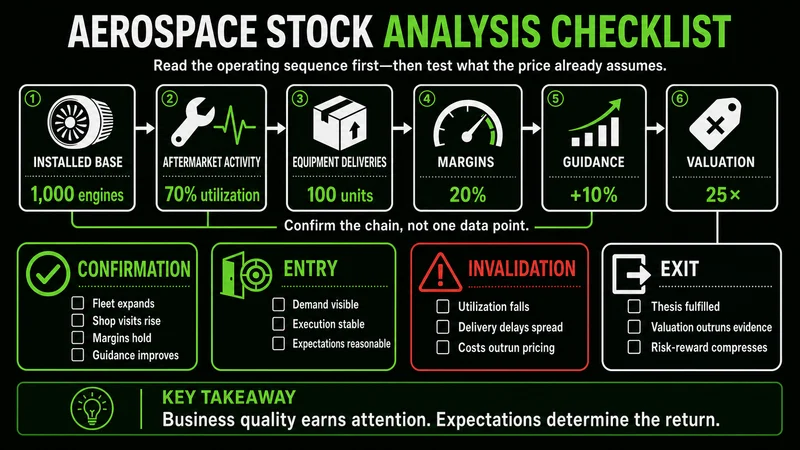 A disciplined review connects aftermarket demand and delivery execution to margins and valuation.
Start with services revenue and shop-visit commentary. Then compare equipment growth with service growth. Review gross and segment operating margins for evidence that mix and execution are improving. Check whether orders convert into deliveries without creating new cost pressure. Finally, compare earnings progress with the valuation multiple.
Use the following questions to keep the process consistent:
- Is services revenue still materially larger than equipment revenue?
- Are shop visits and aftermarket demand supporting margin quality?
- Is the LEAP delivery ramp expanding the installed base without damaging execution?
- Are operating margins expanding, stable, or contracting?
- Does guidance confirm the assumptions already reflected in the valuation?
- Is order growth converting into profitable revenue?
The best confirmation is not one strong figure. It is alignment across service demand, delivery execution, margin behavior, and guidance. The clearest warning is divergence: orders rise, but deliveries stall; deliveries rise, but margins contract; or profits improve, but not enough to support the premium multiple.
GE Aerospace’s FY2025 results show why the aftermarket is the economic center of the company. Services dominate equipment revenue, the business retains a meaningful share of sales as profit, and the installed engine base can support recurring demand. The investment case remains conditional. The operating model must keep converting flight activity into service revenue, and that revenue must become profit fast enough to justify the price investors are paying.
Worth the read?