How Home Depot Makes Money — Margins and Risks
Learn how Home Depot makes money through product mix, margin structure, stock catalysts, cyclical risks, and valuation comparisons with key retail peers.

How Home Depot makes money is straightforward at the top line and more demanding below it. The company sells building materials, décor, and hardlines at scale, but the investment case depends on how much revenue survives merchandise costs, operating expenses, interest, and taxes.
The business produced $159.5 billion in revenue in this financial snapshot. That scale supports meaningful profit, yet it does not protect the stock from weak comparable sales, elevated interest rates, housing softness, tariffs, or execution problems.
How Home Depot makes money across its product lines
Home Depot’s revenue base has three large core product groups and one smaller distribution operation. Building materials contribute $52.8 billion, making that group the largest pillar. Décor follows at $51.8 billion, while hardlines add $48.6 billion. Other operations, including SRS and HD Supply distribution, contribute $6.4 billion.
The mix spreads revenue across construction, finishing purchases, tools, and professional distribution. It also creates different margin profiles. The smaller distribution segment can expand Home Depot’s professional reach, but additional revenue matters only if the company converts it into acceptable operating profit.
A clean way to read the model is as a conversion process: $159.5 billion enters as revenue, $106.2 billion leaves through cost of sales, and $53.3 billion remains as gross profit. After operating costs, $21.5 billion remains as operating income. Interest and taxes reduce that figure to $14.8 billion of net income.
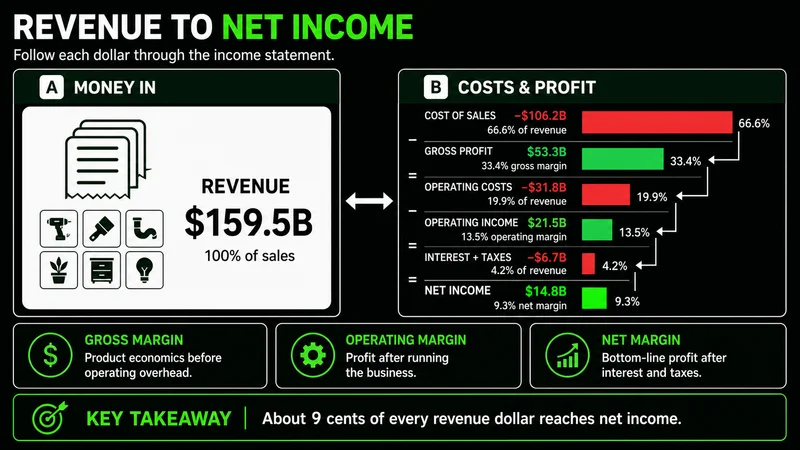 The income statement narrows from revenue through cost of sales, gross profit, operating income, and net income.
The common mistake is treating every revenue dollar as equally valuable. A dollar from lower-margin distribution may add scale without producing the same operating contribution as a dollar from the established store base. Revenue growth is useful only when mix, costs, and capital remain controlled.
The margin funnel explains the business quality
Cost of sales consumes $106.2 billion, or 66.6% of revenue, leaving a 33.4% gross margin. Selling, general, and administrative expense accounts for $28.7 billion, or 18.0% of revenue. Depreciation and amortization add $3.0 billion, or 1.9%. The resulting operating margin is 13.5%, and the net margin is 9.3%.
For every illustrative $100 of revenue, about $66.60 is absorbed by merchandise costs. Roughly $33.40 becomes gross profit, $13.50 reaches operating income, and $9.30 becomes net income after interest and taxes. This is an operating map, not a forecast.
Gross margin measures merchandise economics. Operating margin tests whether store labor, administration, distribution, and other expenses remain disciplined. Net margin shows the final conversion after financing costs and taxes. Watching all three prevents one strong number from hiding deterioration elsewhere.
A large revenue base matters less than the discipline of the conversion beneath it. — MRPNL
The key risk is gradual compression. A modest gross-margin decline becomes more serious when operating expenses remain fixed or rise. Home Depot’s scale supports profitability, but the store network still carries costs when demand slows. The operating-margin trend therefore deserves as much attention as headline revenue.
What moves Home Depot stock when demand changes?
Comparable, or same-store, sales are the first operating signal to watch. They show whether established locations are producing more business without relying on acquisitions. A beat can support the stock because it suggests stronger demand or execution. A miss can raise questions about traffic, ticket size, and expense absorption.
Interest rates and mortgage rates influence big-ticket remodeling demand. When financing remains expensive, households may delay moving or starting discretionary projects. Existing-home sales and housing turnover matter because a purchase often creates repair and renovation spending. Greater housing activity can improve demand, while a housing freeze can restrict it.
Comparable sales and interest rates should be read together. Improving comps during supportive rate conditions strengthen the demand case, while weakening comps during elevated-rate conditions confirm pressure. Mixed signals require patience because one strong quarter may reflect timing rather than a durable change in customer behavior.
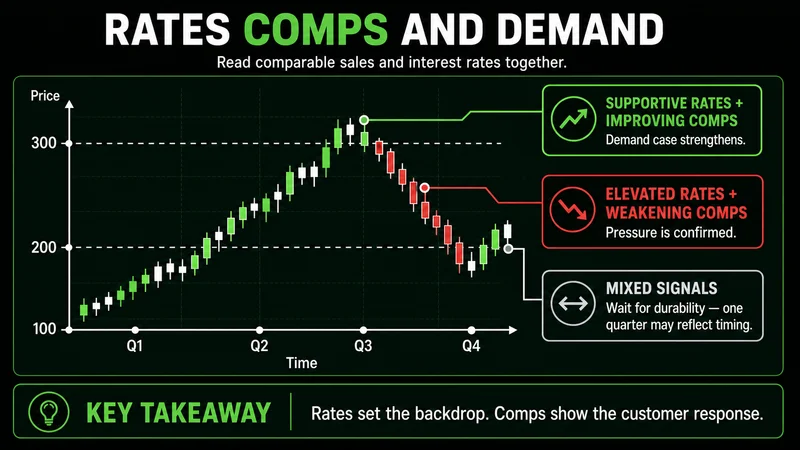 Comparable sales and rates provide the clearest operating confirmation when read together.
The professional customer is another catalyst. SRS and HD Supply can deepen Home Depot’s reach into professional projects and distribution. Successful integration may create a growth leg. Weak demand, poor integration, or lower-margin revenue can dilute the benefit. Quarterly guidance helps show which side of that balance is developing.
Tariffs and input-cost inflation also matter. Higher costs can pressure gross margin if Home Depot cannot offset them through pricing, sourcing, or mix. Investors may react before the full effect appears because the stock reflects expectations about the next margin trend.
The bear case has a defined invalidation point
The bear case starts with a rate-sensitive, cyclical demand model. High borrowing costs can suppress housing turnover and large discretionary projects. A mature U.S. store base can make rapid comparable-sales growth harder. Competition, tariffs, supply-chain inflation, and SRS integration add further risk.
This case strengthens if comparable sales remain weak while operating margin declines. That combination indicates soft demand and inadequate expense adjustment. It becomes more serious if professional growth fails to compensate for weakness in the core store business.
The bear case is invalidated when sustained comparable-sales improvement, healthier housing activity, stable or rising operating margins, and productive professional growth weaken the assumption of cyclical deterioration. One quarterly beat is confirmation to monitor, not full invalidation.
The bullish case also needs invalidation. Rate cuts alone do not guarantee a remodeling recovery. If rates fall but comparable sales, housing turnover, and operating margins fail to improve, the demand thesis is not working. Price may anticipate recovery, but operations must eventually confirm it.
Valuation separates a good company from a good entry
The valuation snapshot places Home Depot near 23 times forward earnings. Lowe’s is near 19 times, while Floor & Decor and Sherwin-Williams are near 28 and 29 times, respectively. Home Depot trades at a premium to Lowe’s but below the specialty peers in this comparison.
The premium can reflect scale, professional reach, return on invested capital, and a dividend track record. Those qualities explain why investors may accept a higher multiple. They do not make every valuation attractive. A premium is justified only while earnings quality, margins, and growth support it.
The practical valuation question is not simply whether 23 times earnings looks high. It is whether the expected recovery in comparable sales, professional demand, and margins is strong enough to support that multiple. If earnings expectations rise while the multiple remains stable, valuation can improve through growth. If earnings expectations fall, the same share price becomes more expensive without the quoted multiple visibly changing at first.
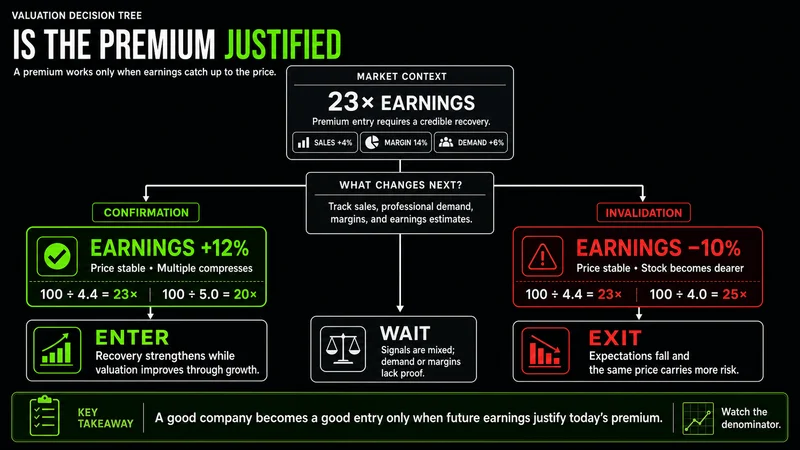 A premium valuation requires operating evidence from comparable sales, margins, and professional demand.
A common mistake is comparing P/E ratios without comparing business mix or cycle exposure. These companies do not have identical customers or margin structures. Peer multiples provide context, but they cannot replace analysis of demand, profitability, and execution.
When this framework does not work
This framework is less reliable during an abrupt macroeconomic shock or major accounting change. Historical margins and peer multiples can become stale before reported earnings catch up. A tariff change, acquisition charge, or severe housing disruption can also distort one period.
It also fails when investors isolate one metric. Comparable sales can improve through pricing while transaction volume remains weak. Revenue can grow through an acquisition while operating margin falls. A low P/E can look attractive because earnings estimates have not yet been reduced.
When the evidence conflicts, reduce certainty. Separate recurring operations from temporary effects, compare several periods, and require agreement among comparable sales, gross margin, operating margin, and guidance. Without that agreement, confirmation remains incomplete.
A practical checklist for reviewing Home Depot
Start with comparable sales, then check whether gross and operating margins confirm that demand is profitable. Review professional-customer growth and SRS integration for evidence that distribution is adding durable value rather than revenue alone.
Next, place company results beside mortgage rates, housing turnover, tariffs, and input costs. Compare the forward P/E with peers only after reviewing the operating evidence.
- Stronger comps, stable margins, and improving professional demand support the quality case.
- Weak comps and falling operating margins strengthen the cyclical bear case.
- Rate cuts without operating confirmation require patience.
- A premium multiple needs strong execution.
- Every thesis needs a condition that proves it wrong.
FAQs
What is Home Depot’s largest revenue category? Building materials are the largest category at $52.8 billion. Décor follows at $51.8 billion, and hardlines contribute $48.6 billion.
What matters most for Home Depot stock? Comparable sales and interest rates are the primary signals in this framework. Housing turnover, professional demand, costs, and guidance provide additional context.
Is Home Depot overvalued compared with Lowe’s? Home Depot is near 23 times forward earnings versus Lowe’s near 19 times. Whether that premium is excessive depends on margins, growth, and execution.
The final read depends on confirmation
Home Depot combines a profitable store base with exposure to housing, rates, and discretionary projects. Its 33.4% gross margin, 13.5% operating margin, and 9.3% net margin show strong conversion. The disciplined approach is to watch demand, confirm profitability, test professional growth, and define the evidence that invalidates the thesis.
Worth the read?