How Does JPMorgan Make Money and Earn Its Premium
How does JPMorgan make money? Follow its interest income, fees, margins, catalysts, risks, and valuation premium against major bank peers.

How does JPMorgan make money? The short answer is scale, spread income, and several fee-producing businesses operating under one balance sheet. In FY2025, the bank generated $182.4 billion of revenue and converted $57.0 billion into net income. The more useful question is whether that earnings engine can keep supporting a premium valuation.
The headline profit is not the full thesis. Investors need to separate current earning power from the rate cycle, credit conditions, operating costs, and expectations already embedded in the stock. A strong bank can still be a poor purchase when its multiple assumes that every favorable condition will persist.
How does JPMorgan make money across its segments?
JPMorgan’s largest engine is net interest income, or NII. This is broadly the difference between interest earned on loans and securities and interest paid on deposits and other funding. The carousel reports $95.4 billion of FY2025 NII, slightly more than half of total revenue. That makes deposit pricing, loan growth, asset yields, and the rate path central to the earnings story.
The other $87.0 billion came from fees and markets-related income. The visible breakdown includes $27.2 billion from markets and principal transactions, $20.3 billion from asset-management fees, $9.6 billion from investment-banking fees, and roughly $13.8 billion from card, lending, and deposit fees. These streams matter because they reduce reliance on one spread-based source, although they introduce their own sensitivity to trading activity, asset values, and deal flow.
Segment reporting shows how that revenue base is distributed. Corporate and Investment Bank revenue was $78.5 billion, Consumer and Community Banking produced $76.6 billion, Asset and Wealth Management contributed $15.3 billion, and Corporate added $8.7 billion. The practical point is diversification: consumer banking, cards, markets, investment banking, and asset management do not peak at the same time, but they can still weaken together during a broad credit or economic contraction.
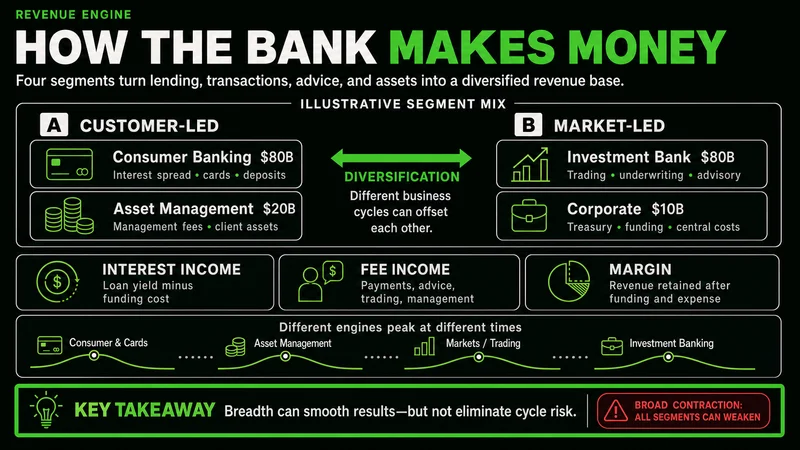 FY2025 revenue flows from interest and fee income into four operating segments.
JPMorgan revenue and profit margins require a bank lens
A common mistake is to evaluate a bank like an industrial company. Banks do not present gross margin as the main operating checkpoint. Pre-provision profit is more useful because it shows what remains after operating expenses but before credit-loss provisions.
From $182.4 billion of revenue, JPMorgan produced $86.8 billion of pre-provision profit, a 48% margin. After a $14.2 billion provision for credit losses, pretax income was $72.6 billion, or 40% of revenue. Taxes of $15.5 billion then left $57.0 billion of net income, equal to a 31% net margin and about $20.02 of diluted earnings per share.
That progression is the concrete example investors should follow. Revenue does not move directly to shareholder earnings. Noninterest expense of $95.6 billion absorbs the largest share, while provisions create a second, cyclical deduction. Reported ROTCE of roughly 20% and ROE of roughly 17% indicate strong returns, but those figures should be tested against the capital and credit environment that produced them.
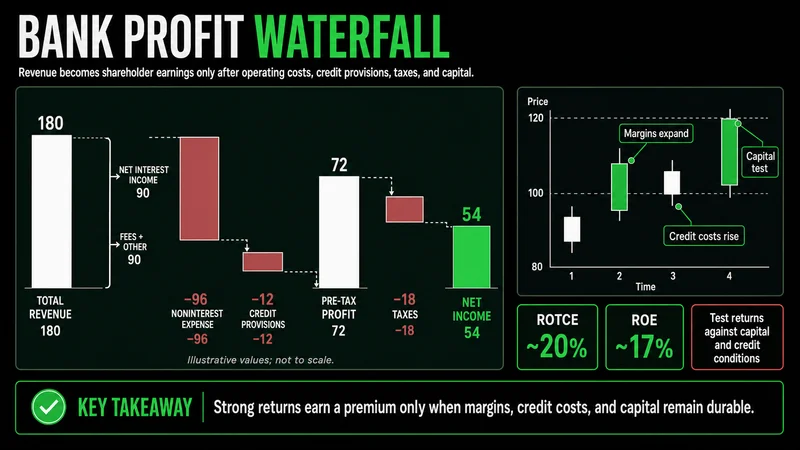 A profit waterfall shows how $182.4 billion of revenue becomes $57.0 billion of net income.
MRPNL principle: A strong margin matters only when the risks required to produce it remain controlled.
What moves JPMorgan stock after earnings?
The stock can react differently from the income statement because price responds to changes in expectations. The visible framework identifies NII guidance as the primary swing factor, with an indicated target of about $103 billion for 2026. A higher target can imply stronger earning power. A lower target can signal that deposit costs, falling asset yields, or slower balance-sheet growth are compressing the spread.
The Federal Reserve’s rate path and deposit betas sit behind that guidance. If rates fall, asset yields may reset while deposit costs decline at a different speed. The result depends on timing and balance-sheet composition, so “lower rates help banks” or “lower rates hurt banks” is too simple to guide a decision.
Markets and trading revenue, investment-banking fees, and an M&A rebound provide additional catalysts. Credit performance matters on the other side. Card net charge-offs were guided near 3.4%, making the direction of consumer losses more important than one isolated quarterly print. Buybacks, dividends, and CET1 capital returns can also support per-share value, provided capital requirements allow them.
The common valuation mistake is paying for peak conditions
JPMorgan traded near 15 times next-twelve-month earnings in the supplied comparison. Bank of America was near 14 times, Wells Fargo near 13 times, and Citigroup near 11 times. The market was therefore assigning JPMorgan a quality premium rather than valuing all large banks as interchangeable balance sheets.
That premium has a rational foundation when superior returns, scale, diversification, and balance-sheet strength persist. The mistake is treating a better business as automatically cheap. A premium multiple increases the amount of operating consistency the company must deliver. Earnings can rise while the stock falls if guidance, credit quality, or capital returns fail to clear an already demanding expectation.
| Valuation question | Constructive reading | Risk reading |
|---|---|---|
| NII outlook | Guidance holds or improves | The rate-cycle tailwind fades |
| Credit costs | Losses remain controlled | Provisions and charge-offs rise |
| Expenses | Revenue growth absorbs spending | A $105 billion-plus expense plan pressures efficiency |
| Premium P/E | High returns justify the spread | Multiple compression offsets earnings |
JPMorgan risks define when the thesis is invalidated
The bear case is not that the bank suddenly stops being profitable. It is that peak earnings and a premium multiple meet at the wrong point in the cycle. Falling rates may reduce the NII tailwind. Rising credit losses may increase provisions. Heavy regulation and Basel-related capital rules may limit balance-sheet flexibility or shareholder distributions.
The expense plan is another test. Spending above $105 billion can support technology, controls, and growth, but the benefit must eventually appear in revenue, efficiency, or risk reduction. If expenses rise while NII normalizes and fee businesses slow, pre-provision profit can compress before net income shows the full damage.
A defined invalidation keeps the analysis disciplined. The premium thesis weakens if NII guidance falls, credit-loss provisions and card charge-offs trend higher, operating expenses outgrow revenue, and ROTCE loses its advantage over peers. One soft quarter does not establish that sequence. Several confirming signals do.
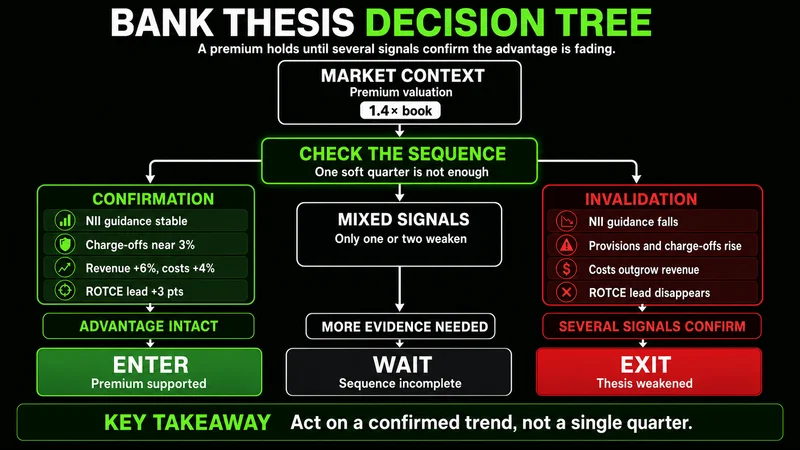 A decision tree defines when strong earnings still support a premium bank valuation.
When this framework does not work cleanly
This framework becomes less reliable when an unusual market event temporarily distorts trading revenue, provisions, or balance-sheet positioning. A single strong markets quarter can make diversified revenue look more durable than it is. A reserve release or sudden provision increase can also obscure the underlying credit trend.
It also does not work when the valuation inputs come from different dates or earnings assumptions. A 15-times forward P/E cannot be compared cleanly with a peer multiple based on stale estimates. The comparison is useful as a starting point, not a complete valuation model.
The same caution applies to rate sensitivity. NII guidance already reflects management’s assumptions about rates, deposit behavior, and asset repricing. If those assumptions change, the earnings framework changes with them. The investor’s job is to react to the updated relationship, not defend the original forecast.
A practical process separates quality from price
Start with the revenue mix. Track NII beside fee and markets income to see whether growth is broad or dependent on one favorable condition. Then move down the income statement to expenses, provisions, pretax income, and net income. This prevents a revenue beat from hiding weaker operating conversion.
Next, monitor the variables that can change forward earnings:
- Compare updated NII guidance with the prior target.
- Review deposit-cost behavior and the expected rate path.
- Track provisions and card charge-offs for credit deterioration.
- Compare expense growth with revenue and pre-provision profit.
- Check whether buybacks and dividends remain supported by CET1 capital.
- Recalculate the P/E premium against bank peers using consistent estimates.
Finally, write the invalidation before forming a view. If the premium depends on high returns, stable credit, and disciplined costs, specify which changes would break that case. This turns valuation from a label into a testable process.
JPMorgan’s FY2025 results show a highly profitable, diversified megabank. They do not prove that any price is reasonable. The premium is justified only while earnings quality, returns, credit performance, and capital strength continue to support it. Quality explains the multiple. Continued execution must defend it.
Worth the read?