How to Avoid Middle-Band Chop With Renko
Learn how to avoid middle-band chop with Renko using Bollinger Band zones, Aroon confirmation, defined stops, and structured exits.

Most traders asking how to avoid middle-band chop with Renko are looking for a better entry signal. The real improvement comes from refusing low-quality locations. Renko bricks clarify directional movement, Bollinger Bands define the setup zone, and Aroon confirms momentum. None should make the decision alone.
The framework is simple: consider bullish setups near the lower Bollinger Band and bearish setups near the upper band. Require a Renko color change or an Aroon momentum cross. Treat the middle band as a progress checkpoint, not an invitation to trade. Define invalidation before targeting a reward.
Why Renko, Bollinger Bands, and Aroon work together
Each tool has one job. Renko filters elapsed time and prints bricks after a fixed amount of price movement. Bollinger Bands provide location through upper, middle, and lower areas. Aroon compares how recently highs and lows occurred, providing momentum confirmation on a scale from 0% to 100%.
The combination separates location, trigger, and confirmation:
- Bollinger Bands identify where a setup may develop.
- Renko identifies a visible change in price direction.
- Aroon checks whether momentum supports that change.
- The recent swing or invalidation brick defines risk.
A lower-band touch is not an automatic buy. An upper-band touch is not an automatic sell. Price can continue pressing a band during a strong trend. The band only identifies an area where the trader should begin watching for evidence.
how to avoid middle-band chop with Renko
The middle Bollinger Band is where directional clarity often deteriorates. Price may alternate around the average while Renko bricks change color repeatedly. Aroon Up and Aroon Down may also cross back and forth without either side maintaining control. These conditions create signals, but they do not create a clean risk-defined setup.
The practical filter is location. If price is near the middle band, wait. A bullish setup should begin near the lower band, and a bearish setup should begin near the upper band. The middle band becomes useful after entry as a progress checkpoint. A long that cannot hold progress through the middle band is weaker than one that moves through it with continued green bricks and supportive momentum.
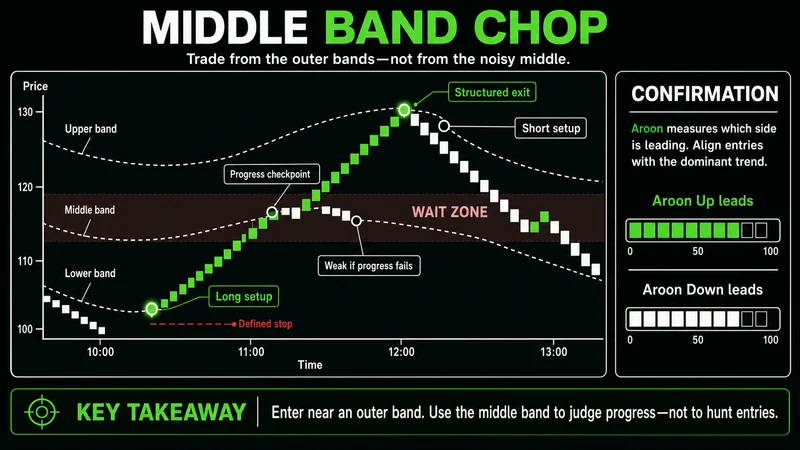 Outer bands define setup zones; the middle band is a progress checkpoint.
Taking fewer color changes is the point. Renko removes some chart noise, but it does not correct poor positioning. A color change between the outer bands lacks the location advantage that defines this setup.
MRPNL principle: A cleaner chart does not make a low-quality location acceptable.
Bullish entries require location, trigger, and confirmation
A bullish setup starts when price touches or closes near the lower Bollinger Band. That area is the setup zone, not the entry itself. Wait for a red-to-green Renko change or for Aroon Up to cross above Aroon Down. When both align, the setup has stronger structural support than a band touch alone.
A concrete example begins with price moving toward the lower band through red bricks. The first green brick appears near that zone, and Aroon Up crosses above Aroon Down. Entry is considered after confirmation. The bullish stop sits below the recent low of the first green brick, below the lower band, or below the nearby swing low, depending on which level invalidates the setup.
The first objective is clean progress away from the lower band. The middle band is the first checkpoint. If price reaches it while green bricks persist and Aroon Up remains above Aroon Down, the move retains confirmation. The upper band becomes a logical exit area. An earlier exit is reasonable if Aroon Up falls below Aroon Down and momentum weakens.
Bearish entries mirror the same decision process
A bearish setup begins near the upper Bollinger Band. Price touching that band only establishes location. The trigger is a green-to-red Renko change, while Aroon Down crossing above Aroon Up confirms that bearish momentum has taken control.
Imagine price advancing into the upper band before printing the first red reversal brick. Aroon Down then moves above Aroon Up. A short entry can be considered after confirmation, with the stop above the recent high of the first red brick, above the upper band, or above the nearby swing high. The correct stop is tied to invalidation, not the smallest distance available.
The middle band is the downside progress checkpoint. If red bricks continue through it and Aroon Down stays above Aroon Up, the lower band becomes the next exit area. If Aroon Down falls back below Aroon Up before price reaches that zone, bearish momentum has faded, and the trade no longer has the same confirmation.
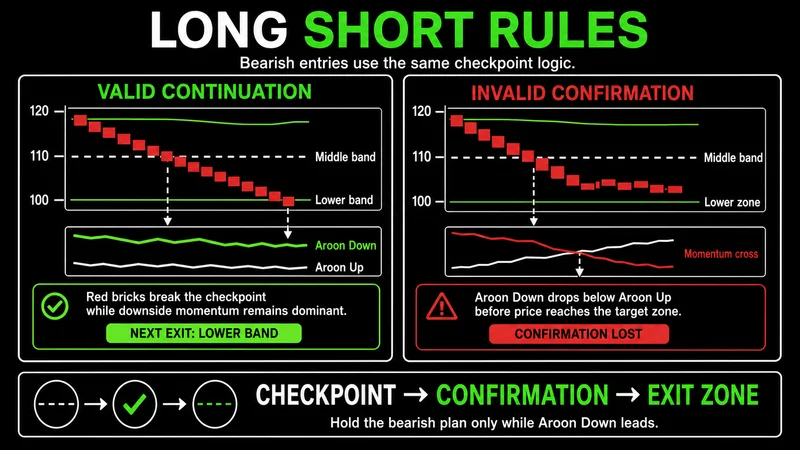 Long and short entries use mirrored location, confirmation, stop, and exit rules.
Stops belong beyond defined invalidation
A stop should answer one question: what price behavior proves the setup wrong? For a bullish entry, that may be a break below the recent low associated with the first green brick. For a bearish entry, it may be a break above the recent high associated with the first red brick. A stop inside ordinary brick movement can be hit without invalidating the idea.
Risk should be measured before entry. If the distance to invalidation is one unit of risk, a 2R target represents twice that distance. The setup uses this 2-to-1 relationship as a target rule, but confirmation still matters. The upper or lower band and an opposing Aroon cross can provide earlier exit information.
A wider invalidation level requires a smaller position if total risk is meant to stay controlled. The chart defines the stop first. Position sizing comes afterward.
The most common mistake is treating zones as signals
The outer bands look precise, which encourages anticipation. A trader sees price touch the lower band and buys before a green brick appears. Another sells at the upper band before Aroon Down confirms. Both are treating a setup zone as a completed signal.
That shortcut removes the method's structure. The sequence is location first, trigger second, confirmation third, and risk definition before execution. Each step filters a different type of weak trade.
Other common mistakes include:
- Entering on repeated color changes near the middle band.
- Ignoring an opposing Aroon cross after entry.
- Placing a stop at an arbitrary distance instead of beyond invalidation.
- Assuming a 2R target overrides weakening momentum.
- Changing Renko brick size or indicator settings without retesting the rules.
A practical checklist keeps execution consistent
Before a long, confirm that price is near the lower band, the Renko sequence has changed from red to green, and Aroon Up is above Aroon Down. Before a short, require the inverse conditions near the upper band. If price is centered around the middle band, the correct decision is usually to wait.
After entry, track the middle band as a progress checkpoint. Keep the invalidation level fixed unless market structure provides a justified adjustment. Consider the opposite band as the planned destination, while remaining responsive to an Aroon momentum reversal. Record whether the exit came from the target, the band, the momentum cross, or the stop so the method can be evaluated consistently.
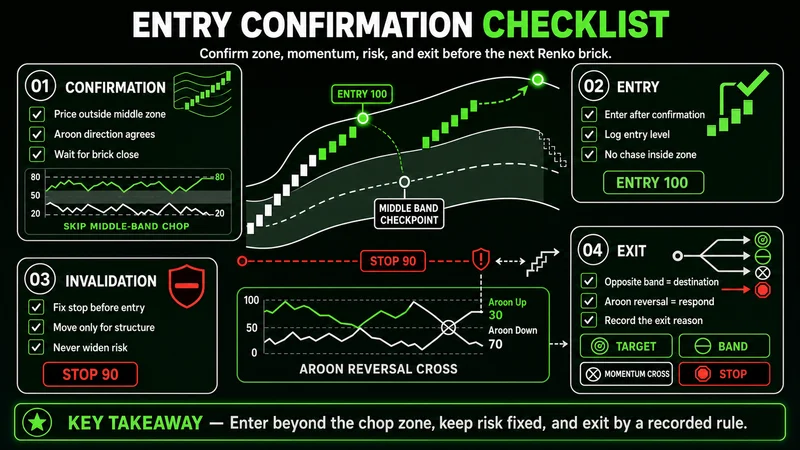 A complete setup aligns location, trigger, momentum, and defined risk.
A pre-trade process can be written as four questions:
- Is price at the correct outer-band setup zone?
- Has Renko printed the required color change?
- Does the Aroon relationship confirm the direction?
- Is the invalidation level clear enough to size the trade?
If one answer is no, the setup is incomplete. Waiting preserves capital and decision quality.
When this setup does not work
This framework performs poorly when price trends persistently along an outer Bollinger Band. An upper-band touch can repeat during a strong advance, while a lower-band touch can repeat during a sustained decline. Entering against that pressure because one Renko brick changes color can produce failed reversals.
It also breaks down when the Renko brick size is poorly matched to volatility. Bricks that are too small can produce frequent color changes and Aroon crosses. Bricks that are too large can delay confirmation until much of the move is complete. No universal setting solves both problems.
Thin, irregular, or sudden volatility can distort the sequence. Renko shows fixed price movement, not the time or path taken between bricks. A sharp move may print several bricks quickly and make confirmation look cleaner than the execution opportunity was.
The response is not more indicators. Test the brick size and indicator settings on the market and session being traded. Track band location, confirmation quality, stop distance, and outcome. If middle-band signals dominate or outer-band reversals fail repeatedly, the condition does not fit the framework.
The edge comes from selection, not prediction
Renko, Bollinger Bands, and Aroon create a disciplined decision sequence. Bollinger Bands define location. Renko provides the directional trigger. Aroon confirms momentum. The recent brick or swing defines invalidation, while the middle and opposite bands organize trade management.
The strongest rule is also the least exciting: skip the middle. A trader does not need every color change. Act only when location, confirmation, and risk align, then exit when the original momentum or structure no longer supports the trade.
Worth the read?