Which Exxon Mobil Business Segment Drives Profit?
Which Exxon Mobil business segment drives profit? FY2025 figures show Upstream as the engine, while other units diversify earnings.

The question which Exxon Mobil business segment drives profit has a clear FY2025 answer: Upstream. Exploration and production contributed $21.4 billion, far more than any other operating segment. Refining, specialty products, and chemicals added diversification, but the central earnings engine remained the production and sale of oil and natural gas.
That distinction matters because Exxon Mobil’s $332.2 billion revenue figure does not explain the quality, durability, or sensitivity of its profit. Investors need to follow the path from revenue to segment earnings, costs, net income, and valuation. Each layer answers a different question.
Which Exxon Mobil business segment drives profit?
Upstream drives profit because it produced $21.4 billion of the segment earnings shown for FY2025. Energy Products, which includes refining and fuels, contributed $7.4 billion. Specialty Products added $2.9 billion, while Chemical Products added $0.8 billion. Corporate and financing activities reduced the total by about $3.6 billion.
The approximate bridge is straightforward. The four operating segments contributed $32.5 billion combined. Subtracting the $3.6 billion corporate and financing drag leaves roughly $28.9 billion, close to the reported $28.8 billion of net income after rounding. This is why the Upstream segment deserves more attention than the companywide revenue headline.
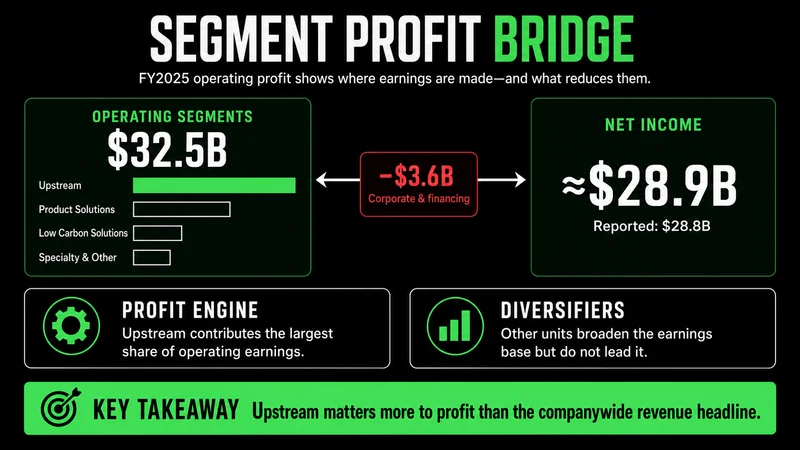 The operating segments contributed about $32.5 billion before the corporate and financing drag.
Upstream is the engine, but it is not the entire machine. Energy Products can provide meaningful support when refining volumes and margins are favorable. Specialty Products and Chemicals are smaller contributors, yet they broaden the earnings base. That balance can soften weakness in one area, but it cannot fully remove the company’s exposure to the commodity cycle.
The useful question is not which segment is largest. It is which variable can change that segment’s earnings fastest. — MRPNL
For Upstream, that variable is primarily the realized price of oil and natural gas. Production volume also matters. A company can produce more barrels and still report lower earnings if commodity prices fall far enough.
The FY2025 profit map starts with revenue, not earnings
Exxon Mobil generated $332.2 billion of revenue and retained $28.8 billion as net income. The resulting net margin was 8.7%, meaning the company kept about $0.087 from each revenue dollar after the costs and deductions shown in the FY2025 map.
The cost base was substantial. Pretax costs and deductions totaled $291.0 billion. Crude and product purchases were the largest component at $184.2 billion. Production and manufacturing costs were $42.4 billion, depreciation and depletion were $26.0 billion, other taxes were $25.2 billion, selling, general, and administrative costs were $11.1 billion, and exploration, interest, and pension items were about $2.0 billion. Income tax and noncontrolling interests then accounted for $12.4 billion.
Those figures produce a pretax margin near 12.4% and a net margin of 8.7%. The gap is not a minor accounting detail. It shows how much revenue must pass through purchases, operations, depreciation, taxes, and corporate costs before it becomes profit available to shareholders.
A common mistake is treating $332.2 billion of revenue as evidence of extraordinary profitability. Revenue measures business scale. Margin measures how efficiently that scale becomes earnings. A large integrated energy company can report enormous sales while retaining a relatively modest percentage because the raw materials and physical operations are expensive.
Oil prices can overpower improvements elsewhere
The FY2025 framework identifies oil price as the primary stock and earnings variable. Upstream volumes from areas such as Guyana and the Permian can support results, while refining crack spreads can strengthen Energy Products. Those operating improvements matter, but their effect must be judged against the direction of commodity prices.
The supplied figures show the tension clearly. Exxon Mobil remained profitable in FY2025, but net income declined from about $33.7 billion in 2024 to $28.8 billion as oil prices eased. Higher production or better execution can reduce the damage from weaker pricing. They do not make the price cycle irrelevant.
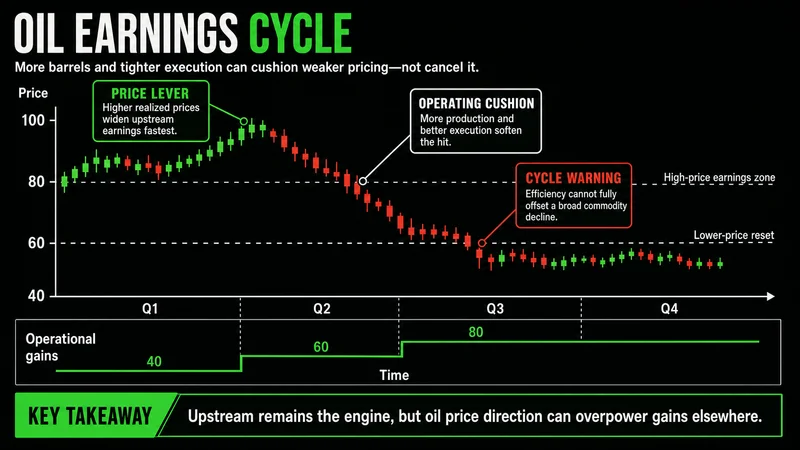 Production growth supports earnings only when commodity pricing and downstream margins hold.
A practical way to read the business is to separate controllable execution from uncontrollable pricing. Management can influence project costs, production growth, refinery reliability, capital allocation, and the timing of investments. It cannot set the global oil price. That price reflects supply, demand, inventories, geopolitics, and economic conditions beyond one company’s control.
This creates a defined invalidation for a bullish earnings thesis. If the thesis assumes that higher volumes will lift profit, it is invalidated when realized commodity prices fall enough to offset the added production and when refining margins fail to provide a counterweight. Volume growth without margin support is activity, not confirmation.
Refining and specialty products provide support, not immunity
Energy Products generated $7.4 billion, making it the second-largest positive contributor in the FY2025 segment map. Refining can benefit when the difference between product prices and crude input costs widens. Strong throughput also helps because fixed assets are being used more effectively.
Specialty Products and Chemical Products contributed $3.7 billion combined. That is meaningful, but it remains far below Upstream’s $21.4 billion. Chemical earnings were only $0.8 billion, showing that diversification does not guarantee equal strength across every business line.
The correct principle is simple: integration changes the shape of the cycle, but it does not eliminate the cycle. Downstream operations may cushion an upstream slowdown in some conditions. In other conditions, weak oil prices, compressed refining margins, and soft chemical demand can occur together. When several segments weaken at once, the diversification argument loses much of its force.
Valuation needs normalized earnings, not one annual result
The valuation slide places Exxon Mobil near a trailing price-to-earnings ratio of 25 times. That was above the displayed historical band of roughly 10 to 15 times. Peer figures on the same comparison were about 33 times for Chevron, 13 times for Shell, and 35 times for BP, placing Exxon Mobil near the middle of that specific peer snapshot.
A trailing P/E ratio can mislead when earnings are cyclical. If profit is temporarily depressed, the ratio rises even when the share price is unchanged. If profit is temporarily elevated, the ratio falls and can make the stock appear cheaper than it would be under normal commodity conditions. The denominator needs as much scrutiny as the price.
The useful question is whether $28.8 billion represents normal earning power, a cyclical low, or a level that still depends on favorable oil prices. A 25-times multiple means something different in each case. Investors should compare the market value with a range of earnings outcomes rather than treating one trailing ratio as a complete verdict.
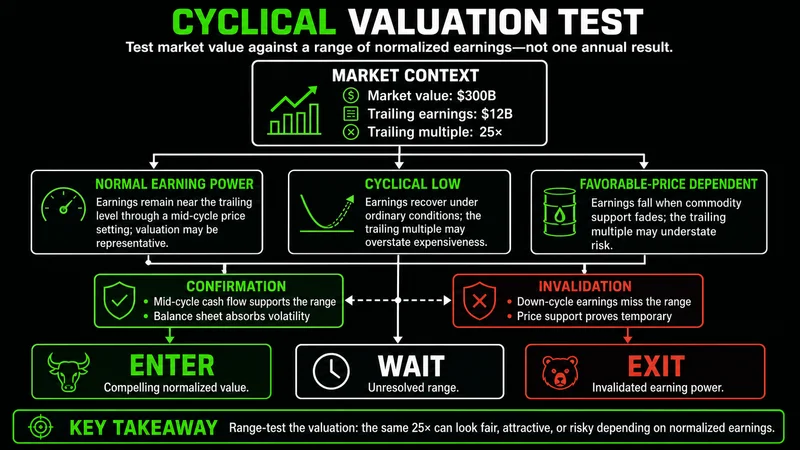 A trailing multiple requires an earnings-cycle test before it can support a valuation conclusion.
The company also completed about $20 billion of buybacks in FY2025. Buybacks can reduce the share count and increase each remaining share’s claim on future earnings. Their value still depends on the purchase price. Repurchasing shares below normalized value can improve long-term per-share economics. Buying aggressively above normalized value can transfer less value than the headline amount suggests.
A disciplined review separates confirmation from narrative
Start with the operating engine, then test what is moving it. The process can be reduced to five checks:
- Track realized oil and natural gas prices because they directly affect Upstream economics.
- Compare production growth with the change in Upstream earnings rather than viewing volume alone.
- Monitor refining margins and volumes to see whether Energy Products is cushioning or amplifying the cycle.
- Measure companywide net margin against the 8.7% FY2025 reference point.
- Judge the trailing P/E against normalized earnings, the company’s historical range, and peer conditions.
The common mistake is starting with a conclusion such as “oil prices are rising, so the stock must rise.” Confirmation requires more. The price move must reach realized earnings, production execution must remain controlled, and the market must not have already assigned an excessive valuation to the expected improvement.
Practical application means writing the invalidation before forming the position. A thesis based on stronger Upstream earnings should be reconsidered if commodity prices weaken, production growth stalls, costs rise faster than output, or downstream margins contract. A valuation thesis should be reconsidered if normalized earnings do not support the multiple being paid.
When this framework does not work cleanly
This framework becomes less reliable during abrupt geopolitical disruptions, major acquisitions, asset sales, accounting changes, or unusually large project start-ups. In those periods, one year’s segment contribution may not represent the company’s continuing earnings structure. Trailing ratios can also become distorted when the earnings denominator changes faster than the share price.
It also does not work cleanly when segment labels are treated as independent businesses. Exxon Mobil is integrated. Upstream production supplies a broader system, and product prices, input costs, internal transfers, taxes, and corporate allocations affect the final result. Segment earnings are useful decision tools, but they are not isolated cash boxes.
The disciplined conclusion is narrower than a simple bullish or bearish label. Upstream was Exxon Mobil’s dominant FY2025 profit engine, while refining, specialty products, and chemicals provided secondary support. The company remained profitable at an 8.7% net margin, but its earnings were still sensitive to oil prices. Any investment view should therefore connect operating performance, commodity conditions, and valuation before treating one favorable metric as confirmation.
Worth the read?