
Operating Ratio — What It Measures and Misses
The operating ratio shows how much of each sales dollar a company spends to operate. Here is the formula, what a good one means, and where it misleads.
The operating ratio is one number that tells you how much of every sales dollar a company burns to keep the lights on. You take cost of goods sold plus operating expenses, divide by net sales, and read the result as a percentage. A 70% operating ratio means 70 cents of each sales dollar runs the business and 30 cents is left as operating profit. Lower is leaner. Most explanations stop there. What matters is what the number does over time and where it misleads you.
What the operating ratio actually measures
The operating ratio meaning is narrower than people assume. It measures operating efficiency, not full profitability. It ignores interest, taxes, and anything below the operating line, answering one question cleanly: for the core business, how much does it cost to produce a dollar of revenue?
That makes it a cousin of operating margin, not a competitor. Operating margin tells you what is left as profit; the operating ratio tells you what was consumed to get there. If the operating margin is 30%, the operating ratio is roughly 70%. Reading them together beats leaning on either alone.
The operating ratio formula, calculated on a real income statement
The operating ratio formula is direct:
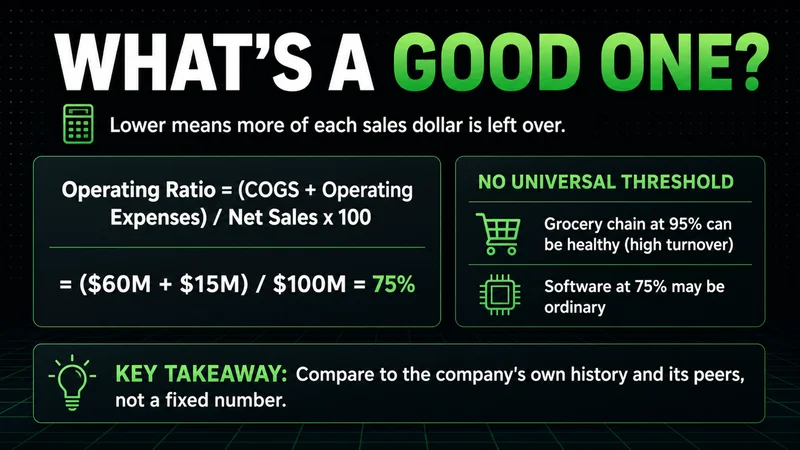
Operating Ratio = (Cost of Goods Sold + Operating Expenses) / Net Sales
The operating ratio calculation needs only three inputs, all sitting near the top of the income statement:
- Net sales, after returns and allowances
- Cost of goods sold, the direct cost of what was sold
- Operating expenses, the selling, general, and administrative costs of running the business
An operating ratio example makes it concrete. A company books $500 million in net sales, $300 million in cost of goods sold, and $100 million in operating expenses. The two cost lines sum to $400 million; divided by $500 million, that is 0.80, or 80%. Eighty cents of every sales dollar is spent before operating profit.
What counts as a good operating ratio
There is no universal good operating ratio, and any source that hands you a single threshold is selling certainty. The right operating ratio benchmark is the company's own history and its closest peers. A grocery chain running at 95% can be healthy because it turns inventory fast on thin margins. A software business at 95% is in trouble.
The interpretation that holds across industries is direction. A ratio below 100% means the core business is profitable before financing and taxes. Above 100% means operations alone are losing money. A falling ratio over several years shows widening efficiency; a rising one shows costs outpacing sales. The operating ratio interpretation is most reliable as a trend, read against peers of similar size and maturity.
Reading the ratio across the cycle, not as a single number
A single quarter tells you almost nothing. The operating ratio earns its keep when you line up five or six years and watch how it behaves through different demand conditions. Costs that look fixed in a strong year reveal themselves as variable in a weak one, and that is where the real story sits.
A ratio is a snapshot. The trend is the evidence. I trust the slope of three years more than the precision of one quarter.
Capital intensity matters too. A heavy manufacturer carries depreciation inside operating expenses, so its ratio sits structurally higher than an asset-light distributor. Comparing the two on the raw number is meaningless.
Where the operating ratio quietly misleads you
This is the part the formula hides. The ratio is clean only when the inputs are clean, and they often are not. Lease accounting can shift costs between operating and financing lines, moving the ratio without changing the business. One-time charges, restructuring, or an unusual write-down can spike operating expenses for a single period and make a healthy company look inefficient.
The operating ratio limitations get worse for conglomerates. A blended ratio across unrelated segments averages a high-margin software arm with a low-margin hardware arm into a number that describes neither. Run a quick check before you trust it:
- Are the cost lines defined consistently year over year?
- Did a one-off item distort this period's operating expenses?
- Is the company a single business or a mix of segments?
- Does lease or accounting treatment differ from the peers you are comparing against?
When the answers are messy, the ratio reads cleanly but means almost nothing. That is the condition where it breaks down, and it breaks quietly, because the math still works.
What does the operating ratio tell investors
For most investors the operating ratio is a screen, not a verdict. It flags companies whose operating efficiency is improving or decaying, and that flag earns a closer look at the full statement. It points to where the rest of the work belongs, not how to conclude it. A falling ratio is a reason to read the segment notes; a rising one is a reason to ask what changed in the cost base.
It also stays silent on a lot. The ratio says nothing about debt, interest coverage, cash conversion, or returns on capital. Treat it as the entry point to efficiency analysis, then move to the metrics beside it: operating margin for the profit side, the efficiency ratio for cost discipline, and the wider set of financial ratios that describe debt and liquidity. The number is useful precisely because it is narrow. Read it for what it measures, respect what it ignores, and let the trend, not the snapshot, carry the weight.
Worth the read?


