
Receivables Turnover Ratio — How to Read the Number
The receivables turnover ratio measures how fast a company collects credit sales. See the formula, an example, benchmarks, and limitations.

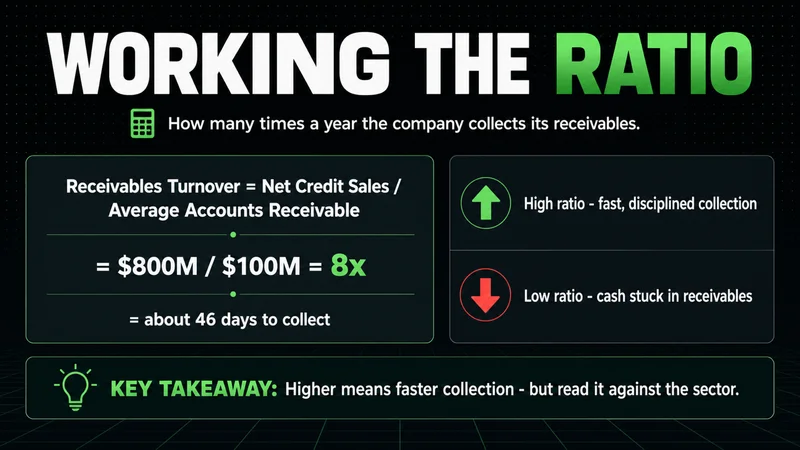
The receivables turnover ratio measures how many times a company collects its average accounts receivable during a period. It is net credit sales divided by average accounts receivable, and it tells you how quickly a business converts what it is owed into actual cash. A higher number means faster collection. A lower number means money is sitting in customers' hands longer than it should.
That single line answers the question most people are asking. The harder question, the one that matters when you are deciding whether to own a stock, is what the number means once you stop reading it in isolation. A ratio is a relationship, not a verdict. Treating it like a verdict is where most analysis goes wrong.
What the receivables turnover ratio actually measures
The receivables turnover ratio is an efficiency measure. It sits in the same family as inventory turnover and asset turnover, and all three try to answer one underlying question: how well does the business turn its resources into cash. Accounts receivable is the money customers owe for goods or services already delivered on credit. Turnover counts how many times, on average, that balance is collected and rebuilt over the year.
Think about the receivables turnover ratio meaning in plain terms. A company sells on credit, records a receivable, and waits to get paid. If it collects and re-lends that credit eight times a year, its receivables turnover is roughly eight. If it manages that cycle only three times, collection is slower and more capital is tied up in unpaid invoices.
This is a balance-sheet and income-statement story working together. Sales come from the income statement. Receivables come from the balance sheet. The ratio links the two, which is why it shows up in nearly every financial-ratio framework an analyst uses.
The receivables turnover ratio formula
The receivables turnover ratio formula is direct:
Receivables Turnover Ratio = Net Credit Sales / Average Accounts Receivable
Two inputs deserve attention. Net credit sales, not total sales, belongs in the numerator. Cash sales never create a receivable, so including them inflates the ratio and flatters the company. In practice, public filings rarely break out credit sales separately, so analysts often substitute total net sales. That is a defensible shortcut, but it is a shortcut, and you should know you are making it.
Average accounts receivable belongs in the denominator. You calculate it by adding the beginning and ending receivable balances for the period and dividing by two:
Average Accounts Receivable = (Beginning AR + Ending AR) / 2
Averaging matters because a single period-end balance can be distorted by timing. A company that pulls in a large order on the last day of the quarter shows a temporarily inflated receivable that does not reflect the typical collection pace.
How to calculate the receivables turnover ratio with an example
The receivables turnover ratio calculation is easier to trust once you walk a number through it. Consider a company with the following figures for the year.
- Net credit sales: $4,800,000
- Beginning accounts receivable: $520,000
- Ending accounts receivable: $680,000
First, find average accounts receivable: (520,000 + 680,000) / 2 = $600,000.
Then divide net credit sales by that average: 4,800,000 / 600,000 = 8.
The receivables turnover ratio is 8. The company collects and rebuilds its receivable balance eight times a year. That is the full receivables turnover ratio example, start to finish, and it scales to any business once you have the two inputs.
Most analysts convert that figure into days, because days are more intuitive than a turnover count. Divide 365 by the ratio: 365 / 8 = roughly 46 days. On average, it takes the company about 46 days to collect after a sale. This is days sales outstanding, and it is the same information expressed on a calendar instead of as a frequency.
How to interpret the receivables turnover ratio
Interpretation is where the receivables turnover ratio earns its place, and where it gets misread most often. A high ratio generally signals efficient collection, a disciplined credit policy, and customers who pay on time. A low ratio suggests slow collection, loose credit terms, or customers under financial stress.
The word "generally" is carrying weight there. Direction is not destiny. Run through what each reading can mean before concluding anything.
A high receivables turnover ratio can indicate:
- Effective collection and a customer base that pays reliably.
- Conservative credit terms that bring cash in quickly.
- A large share of cash sales, which can overstate true collection efficiency.
A low receivables turnover ratio can indicate:
- Slow collection or weak follow-up on overdue invoices.
- Generous credit terms used to win or keep customers.
- A concentrated customer base where one slow payer distorts the whole figure.
The receivables turnover ratio interpretation only becomes useful in context. A single number tells you almost nothing. The trend over several years tells you whether collection is improving or deteriorating. The comparison against direct competitors tells you whether the pace is normal for the business model. Trading without context is gambling with better vocabulary, and the same caution applies to reading a balance sheet: a ratio without a comparison set is a number looking for a story.
What is a good receivables turnover ratio benchmark
There is no universal good number, and anyone who quotes one without naming an industry is guessing. The right receivables turnover ratio benchmark depends entirely on the business model and how that industry sells.
Retailers that take cash and cards at the point of sale post very high ratios, often in the double digits, because receivables barely exist. A manufacturer selling to distributors on 60-day terms might run a ratio of five or six and be perfectly healthy. A software company billing annually looks different again. Comparing a retailer's ratio to a heavy-equipment maker's tells you nothing except that they sell differently.
Two comparisons carry real signal. The first is the company against its own history. A ratio drifting lower year after year is a quiet warning that collection is slipping or credit terms are loosening to chase revenue. The second is the company against close competitors in the same sector. That is the only peer set where the number is genuinely comparable.
How investors use the receivables turnover ratio in stock analysis
Most explanations of this metric stop at the accounting desk. For an investor, the more valuable lens is what the ratio reveals about earnings quality. This is the angle most guides skip, and it is the reason the metric belongs in a stock screen rather than only a bookkeeping review.
Reported revenue is not the same as collected cash. A company can book aggressive sales, watch its receivables balloon, and report growth that never converts to money in the bank. When you see revenue climbing while the receivables turnover ratio falls, that gap is worth questioning. It can mean the company is extending easier credit to manufacture growth, or that customers are struggling to pay. Either way, the quality of those reported earnings is lower than the headline suggests.
This is how a careful investor uses the figure in practice. Pull three to five years of net sales and receivables. Track the turnover trend alongside revenue growth. When the two move together, the growth is converting to cash. When receivables outrun sales and turnover sags, treat the revenue line with more skepticism. The ratio will not tell you the whole story on its own, but it is a reliable early flag for the gap between accounting profit and real cash collection.
Receivables turnover ratio vs inventory turnover ratio
The receivables turnover ratio vs inventory turnover ratio comparison confuses people because both are efficiency measures, but they watch different stages of the same cash cycle. They are complements, not substitutes.
Inventory turnover measures how fast a company sells through its stock: cost of goods sold divided by average inventory. It watches the step where products become sales. Receivables turnover measures how fast the company collects on those sales once they are made on credit. It watches the step where sales become cash.
Read together, they map the cash conversion cycle. A business can sell its inventory quickly yet still strain on cash if it then collects slowly. The two ratios in sequence show where capital is getting stuck. Strong inventory turnover with weak receivables turnover points to a collection problem, not a sales problem. That distinction changes the entire diagnosis, which is exactly why an investor cross-checks both rather than reading either alone.
Receivables turnover ratio limitations
The receivables turnover ratio limitations are real, and ignoring them produces confident, wrong conclusions. This is the part most surface-level explainers leave out.
The biggest weakness is the credit-sales assumption. When filings do not separate credit sales from cash sales, analysts use total sales, which inflates the ratio for any company with meaningful cash revenue. The number looks better than collection actually is.
Seasonality is the next trap. Averaging only the beginning and ending balances misses the swings in between. A retailer with a heavy fourth quarter can show a receivable balance at year-end that bears no resemblance to its mid-year pace, distorting the average and the ratio built on it.
This is where the metric breaks down most clearly. For businesses with lumpy, seasonal, or project-based revenue, the receivables turnover ratio loses much of its meaning on an annual basis, because the average it depends on no longer represents normal operations. A construction firm that bills in large milestones, or a company that shifts its sales mix sharply toward cash during one period, can post a ratio that misleads more than it informs. In those cases the calendar of collection matters more than the annual average, and you need monthly or quarterly receivables data or a days-sales-outstanding view by period before the figure means anything. The ratio rewards steady, recurring credit sales and punishes anyone who applies it to a business that does not have them.
FAQs
What is the receivables turnover ratio in simple terms? It is the number of times a company collects its average accounts receivable in a period. You calculate it as net credit sales divided by average accounts receivable. A higher figure means the business is turning credit sales into cash more quickly.
How do you calculate the receivables turnover ratio? Divide net credit sales by average accounts receivable. Average accounts receivable is the beginning balance plus the ending balance, divided by two. If filings do not break out credit sales, analysts substitute total net sales and note the approximation.
What is a good receivables turnover ratio? There is no single good number; it depends on the industry and sales model. A cash-heavy retailer runs a high ratio, while a manufacturer on 60-day terms runs a lower one. Compare a company against its own history and against direct competitors rather than to a fixed target.
What the receivables turnover ratio is worth to you
The receivables turnover ratio is a clean way to see how fast a company turns credit sales into cash, calculated as net credit sales over average accounts receivable. The formula is simple. The judgment is not. A reading only means something next to the company's own history and its direct peers, and it loses its footing entirely for seasonal or lumpy-revenue businesses. Used with that discipline, the ratio is a reliable early signal of collection health and earnings quality. Used in isolation, it is just a number, and a number without context decides nothing.
Worth the read?


