
Quantitative Factors in Fundamental Analysis — A Guide
Quantitative factors in fundamental analysis are the measurable numbers — revenue, margins, cash flow, ratios — read in sequence and context.

Quantitative factors in fundamental analysis are the measurable numbers in a company's financial statements — revenue, earnings, margins, debt, cash flow, and the ratios built from them — that you read to judge whether a stock is priced fairly relative to what the business actually produces. They are the part of the work you can count, not the part you have to interpret. Most explainers stop there and hand you a list of ratios. The harder truth is that the numbers only mean something in sequence and in context, and they go quiet at exactly the moments traders most want certainty.
I trade index futures and U.S. equities, so I am not pretending fundamentals drive my intraday execution. They do not. But the quantitative side of fundamental analysis is the cleanest framework I know for deciding which equities are worth holding through noise, and the discipline it teaches — read the number, then ask what would make it lie — carries directly into risk-defined trading.
What quantitative factors in fundamental analysis actually measure
Quantitative factors are the inputs you can pull straight off a financial statement and verify. They live in three documents. The income statement shows what the company earned and spent over a period. The balance sheet shows what it owns and owes at a point in time. The cash flow statement shows where the money actually moved, which often disagrees with reported profit.
The distinction that matters: quantitative factors are objective. Two analysts pulling the same filing should arrive at the same revenue figure and the same debt load. That objectivity is the strength. It is also the trap, because a clean number can sit on top of a deteriorating business and still look reassuring for a quarter or two.
Quantitative factors vs qualitative factors
This is the comparison most readers come for, so it is worth being precise. Quantitative factors are countable: revenue growth, profit margin, return on equity, the price-to-earnings ratio. Qualitative factors are judgment calls: management quality, competitive moat, brand strength, regulatory exposure. One is arithmetic. The other is interpretation.
Neither stands alone. A company can post excellent quantitative metrics while a qualitative problem — a founder leaving, a patent expiring, a regulator circling — quietly removes the foundation those numbers stand on. The quantitative factors in fundamental analysis tell you what has already happened with precision. The qualitative factors tell you whether it is likely to continue. Treating the math as the whole answer is where overconfident analysis usually begins.
The core quantitative metrics worth tracking
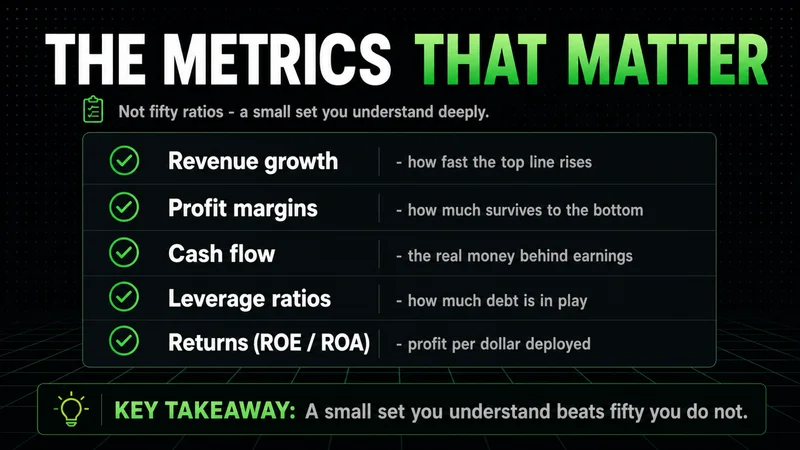
You do not need fifty ratios. You need a small set you understand deeply enough to know when they are misleading. These are the quantitative metrics that carry the most weight for most equities:
- Revenue and revenue growth rate. The top line, and how fast it is expanding. Growth that decelerates quarter over quarter is a signal long before earnings reflect it.
- Earnings per share and earnings growth. Net income attributed to each share. Watch for growth driven by buybacks rather than the underlying business.
- Profit margins. Gross, operating, and net. Margins reveal pricing power and cost discipline more honestly than headline revenue does.
- Return on equity. How efficiently the company turns shareholder capital into profit. High ROE financed by heavy debt is not the same as high ROE from operations.
- Price-to-earnings ratio. What the market pays per dollar of earnings. Context-dependent — a high P/E is expensive only relative to growth and sector.
- Free cash flow. Cash left after the business reinvests in itself. Profit can be engineered on paper; sustained free cash flow is much harder to fake.
Each of these is a quantitative factor. The skill is not memorizing the formulas. It is knowing which one is load-bearing for the specific company in front of you.
A practitioner framework for reading the numbers in order
Most guides hand you the ratios as a flat list. That is the part the top results miss. The numbers are far more useful read in sequence, because each one frames the next. Here is the order I use, and the checklist a beginner can follow:
- Start with revenue and its trend. Is the business growing, flat, or shrinking? Set that frame before anything else.
- Move to margins. Growing revenue with falling margins means the company is buying growth. That changes how you read everything downstream.
- Check earnings quality against cash flow. If net income is rising but free cash flow is not, the profit may be an accounting artifact. The cash flow statement is the referee.
- Read the balance sheet for debt load. How much borrowing supports those returns? Strong metrics on a fragile balance sheet invert quickly under stress.
- Only now look at valuation. P/E and similar multiples mean nothing until you know what you are paying for. Valuation is the last step, not the first.
Run those five in order and the quantitative factors stop being a pile of numbers and become a story about the business. That sequencing is the difference between analysis and gambling with better vocabulary — the inputs only matter when they align with the structure underneath them, not when they are read in isolation.
Where the quantitative factors stop working
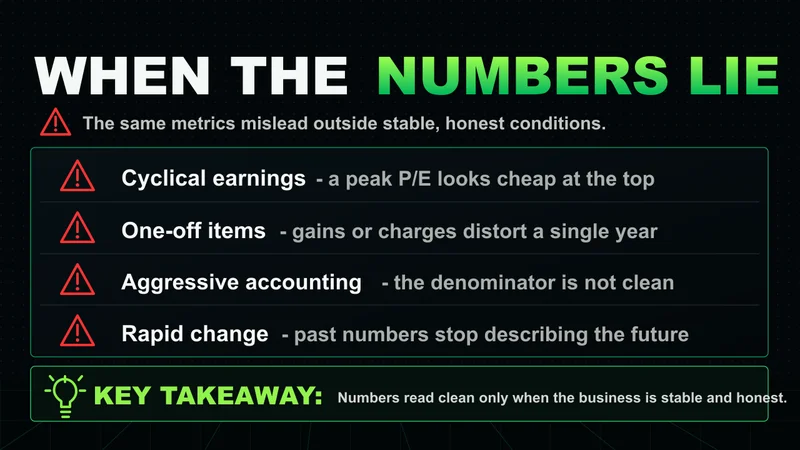
This is the section the clean explainers skip, and it is the one that protects capital. Quantitative factors read cleanly when the business is stable and the accounting is honest. Outside those conditions, the same numbers mislead.
A trailing P/E is meaningless for a company whose earnings are about to reset — the denominator you are dividing by no longer exists. Margins look healthy right up until a single large customer leaves. Return on equity flatters a company that has loaded the balance sheet with debt, because debt shrinks the equity base the ratio divides by. And during a regime shift — a rate cycle turning, a sector repricing — historical quantitative factors describe a world that has already ended. The math is backward-looking by construction. When the forward picture diverges from the trailing data, the numbers are the last thing to update, not the first.
That is the practitioner's caution. Quantitative factors are reactive, not predictive. They tell you precisely where the business has been. They say much less about where it is going, and they say almost nothing during the volatility-driven moments when the gap between past and future opens fastest.
Common quantitative analysis mistakes beginners make
The recurring errors are not about math. They are about context and discipline:
- Treating a single ratio as a verdict instead of one input among several.
- Comparing a company's P/E to the broad market rather than to its own sector and growth rate.
- Trusting reported earnings without cross-checking free cash flow.
- Ignoring the balance sheet because the income statement looks good.
- Confusing precision with accuracy — a number carried to two decimals is still wrong if the assumption behind it is wrong.
Avoiding these does not require more metrics. It requires reading the ones you have with context.
FAQs
What are quantitative factors in fundamental analysis in simple terms? They are the measurable numbers from a company's financial statements — revenue, earnings, margins, debt, and cash flow, plus the ratios built from them. They are the objective, countable side of analyzing a stock, as opposed to subjective judgments about management or competitive position.
What is the difference between quantitative and qualitative factors? Quantitative factors are countable and objective, like revenue growth and the price-to-earnings ratio. Qualitative factors are interpretive, like management quality or brand strength. The quantitative side tells you what has happened with precision; the qualitative side tells you whether it is likely to continue.
What are the most important quantitative metrics to start with? Revenue and its growth rate, profit margins, earnings, free cash flow, return on equity, and the price-to-earnings ratio. You do not need dozens. A small set you understand deeply is more useful than a long list you read mechanically.
How do you actually do quantitative analysis step by step? Read the numbers in order: revenue trend first, then margins, then earnings checked against cash flow, then the balance sheet for debt load, and valuation last. Each figure frames the next, so the sequence matters as much as the individual numbers.
Can quantitative factors be misleading? Yes. They are backward-looking, so they describe where a business has been, not where it is going. A trailing P/E breaks down when earnings are about to reset, and strong ratios can sit on a fragile balance sheet. The numbers are the last thing to update during a regime shift, not the first.
Worth the read?


