
Dead Cat Bounce — How to Spot a Failing Rally
A dead cat bounce is a brief rally inside a downtrend that fails. Learn how to identify one, confirm it, and avoid buying recoveries that are not real.
A dead cat bounce is a brief recovery inside a larger downtrend — a rally that fails and gives way to lower prices. The pattern matters because it looks exactly like the early stage of a real reversal, and most traders cannot tell the two apart at the moment it forms. The honest answer is that nobody can with certainty. What separates disciplined traders from trapped ones is not prediction. It is how they handle confirmation, position sizing, and invalidation while the bounce is still ambiguous.
That framing is the opposite of how the pattern is usually taught. Most explanations treat the dead cat bounce as something you identify and then trade. In live conditions, it is something you survive first and classify later. This guide covers what the pattern is, why it forms, how to read it on a chart, and — more useful than any of that — the exact conditions that tell you your read was wrong.
What is a dead cat bounce?
A dead cat bounce is a temporary rally during a sustained decline. Price falls hard, recovers part of the loss over a few sessions or a few bars, and then rolls over and breaks below the prior low. The recovery was not new demand. It was a pause.
The name comes from a Wall Street remark in the 1980s, when analyst Raymond DeVoe Jr. warned clients about a weak stock that had ticked higher:
"If you threw a dead cat off a 50-story building, it might bounce when it hit the sidewalk." — Raymond DeVoe Jr.
The meaning behind the phrase is blunt: a bounce proves nothing about health. A falling market will produce rallies on the way down, and some of them look convincing. The dead cat bounce chart pattern only completes when price takes out the low that preceded the bounce — which means, by definition, you can only label it with full confidence after the fact. That asymmetry drives everything else in this article.
Why the bounce happens — short covering, not conviction
The mechanics matter because they explain why the rally looks real while it lasts. Several flows can lift a declining market at the same time:
Short covering. Traders who sold the decline take profits by buying back their positions. That buying lifts price, but it is position closing, not new demand.
Dip buyers. Participants anchored to higher prices see a discount and step in early, often without waiting for structure to stabilize.
Oversold mechanics. After a fast markdown, sell-side liquidity thins out. Even modest buying moves price up quickly through a thin book.
Systematic rebalancing. Funds that rebalance on schedule buy weakness mechanically, regardless of outlook.
None of these flows requires anyone to believe the decline is over. That is the defining feature. A dead cat bounce is a liquidity event wearing the costume of a recovery. When the covering finishes and the rebalancing flows pass, the sellers who drove the original decline are usually still there — and the bounce runs out of fuel at the first meaningful supply zone above.
How to identify a dead cat bounce on a chart
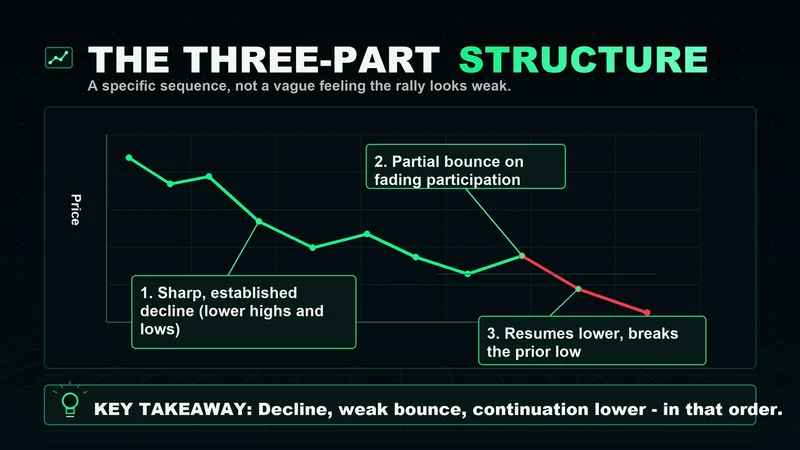
You are looking for a specific sequence, not a vague feeling that the rally seems weak. The structure reads in three parts:
A sharp, established decline. The pattern requires a real downtrend first — lower highs and lower lows with momentum, not a quiet drift.
A partial recovery on fading participation. The bounce retraces a portion of the drop, commonly into a prior support level that now acts as resistance. Volume on the bounce is usually lighter than volume on the decline — buyers are fewer and less aggressive than the sellers were.
Failure and continuation. Price stalls at resistance, fails to hold its gains, and breaks the prior low. That break is what completes the pattern.
The character of the bounce tells you the most. Real reversals tend to show displacement — strong, directional bars that break structure and then hold their ground on the retest. A dead cat bounce tends to grind upward in overlapping bars, reach an obvious resistance level, and stall without acceptance above it. Watch how price behaves at the prior support-turned-resistance zone. Rejection there, on declining volume, is the pattern's signature.
No single dead cat bounce indicator exists, and that is worth saying plainly. Volume, moving averages, and momentum tools can each add context — a bounce that dies under a declining 50-period average on shrinking volume is informative. But indicators describe the bounce; they do not classify it. Structure does.
Dead cat bounce vs. trend reversal — what actually separates them
This is the comparison that costs traders money, so it deserves precision. Both patterns start identically: a decline, then a rally. The difference shows up in what price does at and after the first significant resistance.
A genuine reversal changes structure. Price breaks above the last lower high — the swing that defined the downtrend — and then holds above it on the retest. That sequence, break plus acceptance, is what a market structure shift looks like. Until it happens, every rally inside a downtrend is just a rally inside a downtrend.
A dead cat bounce never makes that break. It approaches the prior lower high, or a support level that flipped to resistance, and gets rejected. The pullback that follows takes out the recent low, and the trend resumes.
Two practical markers help in real time. First, retracement depth: bounces that recover only a shallow portion of the decline and stall are behaving like corrections, while moves that reclaim most of the drop and break structure are behaving like reversals. Second, behavior on the retest: a reversal holds its reclaimed level when price comes back to test it; a bounce gives the level up. Neither marker is certain. Both are readable.
Confirmation comes before the trade, not after
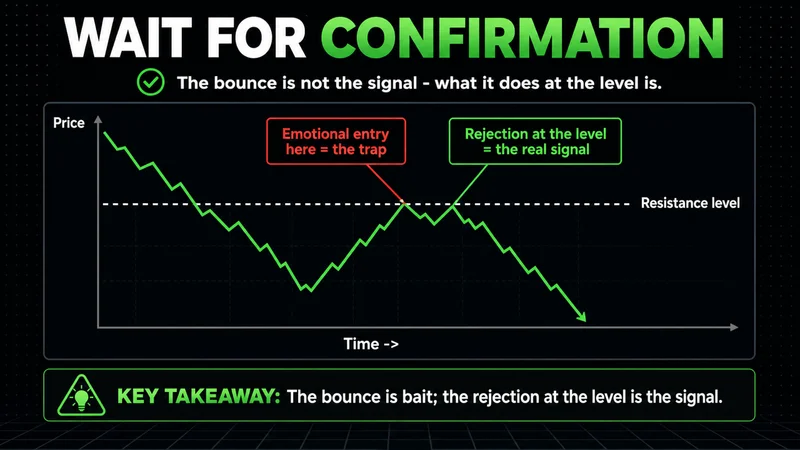
Most traders treat the bounce itself as the trading signal. It is not. The signal is what price does after the bounce reaches a level that matters.
I have watched the same mistake repeat across years of sessions: most failed entries around this pattern come from traders acting emotionally on the rally instead of structurally on its resolution. The bounce is exciting. It moves fast, it recovers visible losses, and it invites participation before the market has shown anything. Confirmation is the discipline of waiting for the market to resolve the ambiguity for you.
For a short thesis — treating the rally as a dead cat bounce — confirmation looks like rejection at resistance: price reaches the prior support-turned-resistance or the declining moving average, fails to gain acceptance above it, and prints a lower high. Entries after that rejection are risk-defined; the new lower high is the invalidation. For a long thesis — treating the rally as a reversal — confirmation looks like the structural break described above, held on a retest.
Either way, confirmation costs you price. You will never enter at the extreme. That cost is the fee for not being the trader who bought a bounce three bars before it died.
Timeframe changes how much the pattern means
The same shape carries different weight on different timeframes, and almost no explanation of this pattern says so. On a daily equity chart, a dead cat bounce develops over days or weeks, with overnight gaps, earnings risk, and broad market flows all feeding it. The pattern is slower and noisier, but a completed failure on a daily chart reflects genuine positioning.
Intraday, the calculus changes. On index futures like NQ and ES, bounce-and-fail sequences print constantly during high-volatility sessions — a sharp markdown, a short-covering pop, a stall, continuation. The structure is the same; the reliability is not uniform across the session. A bounce that fails during regular trading hours, with full participation behind it, carries information. The same sequence overnight, on thin liquidity, means very little — the structure reads cleanly, but the participation behind it is too shallow to trust, and the open frequently invalidates everything the overnight session drew.
There is no single best timeframe for the pattern. The practical rule is to classify the bounce on the timeframe you intend to trade, then check one level higher for context. An intraday bounce inside a daily downtrend is a different environment from the same bounce inside a daily uptrend, and treating them identically is how a clean pattern produces sloppy results.
The invalidation line — when the short thesis is simply wrong
Here is where this pattern stops working, and it should be defined before any position exists, not negotiated afterward.
The dead cat bounce thesis dies when price breaks the last lower high and holds above it. Acceptance matters as much as the break: a wick through the level that immediately fails can be a liquidity sweep, but consecutive closes above the broken swing, followed by a retest that holds, is a market structure shift. At that point the rally is no longer a bounce inside a downtrend. It is the first leg of something else, and shorts positioned for continuation are positioned against the new structure.
This is also where the pattern's edge disappears entirely in certain conditions. In strong macro-driven tape — a policy surprise, a violent repricing — the first sharp decline often is the anomaly, and the "bounce" recovers everything because the selling was forced rather than informed. The pattern assumes the downtrend reflects real positioning. When the decline itself was a dislocation, fading the recovery fails repeatedly, and no amount of volume analysis rescues the read. If the bounce keeps absorbing supply at levels where it should be rejected, the correct response is not a better entry. It is standing down.
Defined invalidation converts an opinion into a trade. Without it, a dead cat bounce short is just a bet that the market keeps falling because it has been falling.
Common mistakes traders make with a dead cat bounce
The pattern punishes a predictable set of behaviors:
Buying the bounce as a bottom. Catching the low of an established downtrend without a structural break is the single most expensive habit this pattern feeds.
Shorting the bounce without confirmation. Fading every rally in a downtrend works until one of them is the reversal. Entries without a rejection or a lower high have no defined risk point.
Reading the pattern from the current bar. The pattern completes when the prior low breaks. Labeling it earlier is a probability assessment, and sizing should reflect that uncertainty.
Ignoring participation. A bounce on expanding volume that holds its retests is not behaving like a dead cat bounce, whatever the trend context suggests.
Moving the invalidation. Widening a stop because the bounce "has to fail" converts a risk-defined trade into an opinion with unlimited cost.
Each of these is an emotional response wearing analytical clothing. The pattern itself is neutral. The losses come from acting before the structure resolves or refusing to accept what the resolution showed.
A dead cat bounce checklist before you act
A short checklist forces process over outcome. Before treating any rally as a dead cat bounce, confirm:
An established downtrend exists — lower highs, lower lows, real momentum behind the decline.
The bounce is retracing on lighter participation than the decline that preceded it.
Price is approaching a level that matters — prior support turned resistance, the last lower high, or a declining moving average.
A rejection or lower high has actually printed. If it has not, there is no signal yet — only anticipation.
The invalidation is defined: the exact level that, if reclaimed and held, proves the bounce was a reversal.
Position size assumes the read can be wrong, because sometimes it will be.
If any line fails, the setup is incomplete. Waiting costs nothing but price. Entering early costs capital, and in a pattern that can only be confirmed in hindsight, capital preservation is the only edge available before confirmation arrives.
FAQs
What is a dead cat bounce in simple terms? It is a short-lived recovery inside a falling market. Price drops sharply, rallies enough to look like a recovery, then fails and continues lower. The bounce reflects short covering and early dip buying rather than a genuine change in demand.
How long does a dead cat bounce last? There is no fixed duration. On daily charts a bounce can run from a few sessions to a few weeks; intraday it can resolve within hours or minutes. The pattern is defined by structure — a partial retracement that fails and breaks the prior low — not by time.
What causes a dead cat bounce? The most common drivers are short covering, early dip buyers anchored to higher prices, thin sell-side liquidity after a fast decline, and mechanical rebalancing flows. None of these requires conviction that the decline is over, which is why the rally fails once those flows are spent.
How can you tell a dead cat bounce from a real trend reversal? Watch the last lower high. A reversal breaks above it and holds the level on a retest — a market structure shift. A dead cat bounce gets rejected at or below it and then takes out the prior low. Until that break and hold occurs, the downtrend remains in control.
What is the best timeframe for spotting a dead cat bounce? The timeframe you trade, checked against one timeframe higher for context. Daily-chart bounces carry broader positioning information; intraday bounces on index futures resolve faster but mean little on thin overnight liquidity. The structure is identical — the reliability is not.
Can you trade a dead cat bounce from the long side? Some traders scalp the bounce itself, but it is a low-quality proposition: the move is countertrend, the fuel is short covering, and the failure point is unpredictable. If the rally is real, structure will confirm it and offer a later entry with defined risk.
What invalidates a dead cat bounce? A reclaim of the last lower high with acceptance — consecutive closes above it and a retest that holds. At that point the rally has changed the structure of the market, and treating it as a bounce is fighting the new trend rather than trading the old one.
Do indicators help confirm a dead cat bounce? They add context, not classification. Declining volume on the bounce, rejection at a falling moving average, and weakening momentum all support the read, but the pattern is confirmed by structure — the failure at resistance and the break of the prior low — not by any indicator value.
Worth the read?


