
Debt to Equity Ratio — How to Read It as Risk
The debt to equity ratio shows how much a company borrows against owner capital. Here is how to read it as a measure of risk, not a grade.
The debt to equity ratio measures how much of a company is financed by borrowed money versus money put in by its owners. You calculate it by dividing total liabilities by total shareholders' equity. A reading of 1.5 means the business carries $1.50 of debt for every $1.00 of equity. That single number tells you, at a glance, who has the larger claim on the company if conditions turn: the lenders or the owners.
Most explanations stop at the formula. The number only becomes useful when you treat it as a measure of fragility under stress, not a grade on a report card. A high ratio is not automatically bad, and a low one is not automatically safe. What matters is whether the structure survives a bad quarter.
What the debt to equity ratio actually measures
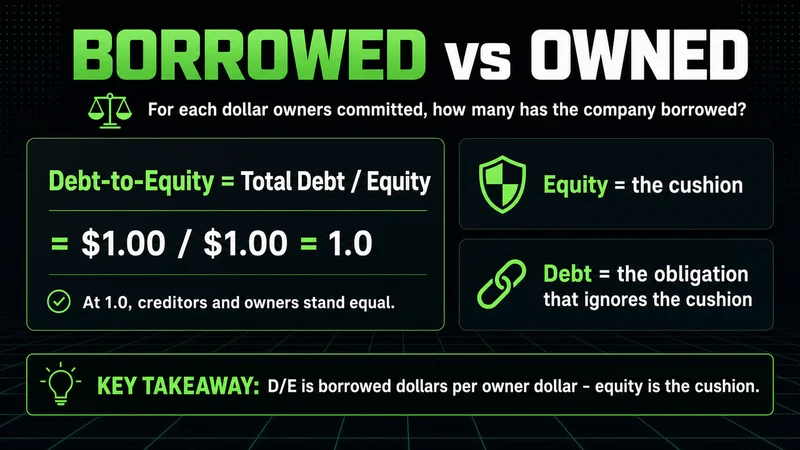
The ratio answers one question. For each dollar the owners have committed, how many dollars has the company borrowed? Equity is the cushion. Debt is the obligation that does not care about the cushion.
When the ratio sits at 1.0, creditors and shareholders have an equal stake in the assets. Above 1.0, the company leans more on borrowing. Below 1.0, it leans more on owner capital. The further the number climbs, the more the company depends on lenders staying patient and revenue staying intact.
Think of equity as the distance between a company and its creditors. A thin cushion absorbs less before the obligations start to bite.
How to calculate the debt to equity ratio
The debt to equity ratio formula is straightforward:
Debt to Equity Ratio = Total Liabilities / Total Shareholders' Equity
Both figures come straight off the balance sheet. The judgment is in what you count as debt.
Total liabilities, the broad version, includes everything the company owes: short-term payables, accrued expenses, and all interest-bearing debt.
Total debt, the stricter version, narrows it to interest-bearing obligations such as loans, bonds, and the debt portion of leases.
Shareholders' equity is total assets minus total liabilities, the residual that belongs to owners.
The stricter version isolates financing decisions from operating obligations. Both are valid. The mistake is comparing one company's broad ratio against another's strict ratio and pretending the comparison means something.
A debt to equity ratio example worth working through
Take a company with $400,000 in total liabilities and $250,000 in shareholders' equity. Divide 400,000 by 250,000 and you get 1.6. For every dollar of owner capital, the business carries $1.60 of obligations.
Now hold that 1.6 against context. If this is a software firm with light fixed costs, 1.6 is heavy and worth questioning. If it is a utility with regulated, predictable cash flow, 1.6 is unremarkable. The same number reads as caution in one place and routine in another.
That is the part most beginners skip. They memorize the calculation and then apply a single threshold to every company they see.
What is a good debt to equity ratio
There is no universal good number. A ratio below 1.0 is often treated as conservative, and many analysts grow cautious above 2.0, but the threshold that matters is the one set by the industry.
Industry type | Typical D/E behavior |
|---|---|
Technology and software | Low, often 0.2 to 0.6, equity-funded growth |
Consulting and services | Below 1.0, little need for heavy borrowing |
Manufacturing and industrials | Moderate to high, equipment-driven |
Utilities, telecom, and real estate | High, frequently above 2.0, asset-backed debt |
Two forces explain most of that spread:
Capital-intensive businesses carry more debt because they buy expensive, long-lived assets that produce steady, predictable cash to service it.
Asset-light businesses carry less because they have less to borrow against and less stable revenue to cover fixed payments.
Comparing a utility to a software company on this single metric tells you almost nothing.
How to interpret the debt to equity ratio under stress
This is where a trader and an accountant part ways. The accountant records the ratio. The trader asks what happens to it when revenue drops 20%.
Debt does not flex with the business. Interest is due whether the quarter was strong or weak. Equity absorbs the shock first, which is why a thin equity cushion turns an ordinary downturn into a solvency question. A company at 0.5 has room to absorb a bad year. A company at 3.0 in a cyclical industry has far less.
Two readings deserve more weight than the raw level:
The trajectory. A ratio climbing from 0.9 to 1.8 over four quarters is a company changing its risk profile, and price often reacts to the trend before the headline number looks alarming.
The cyclicality of the revenue behind it. The same 2.0 is routine for a regulated utility and dangerous for a business whose sales swing with the economy.
A stable 1.8 is a known quantity. A rising 1.8 is a question.
How investors and traders use the debt to equity ratio
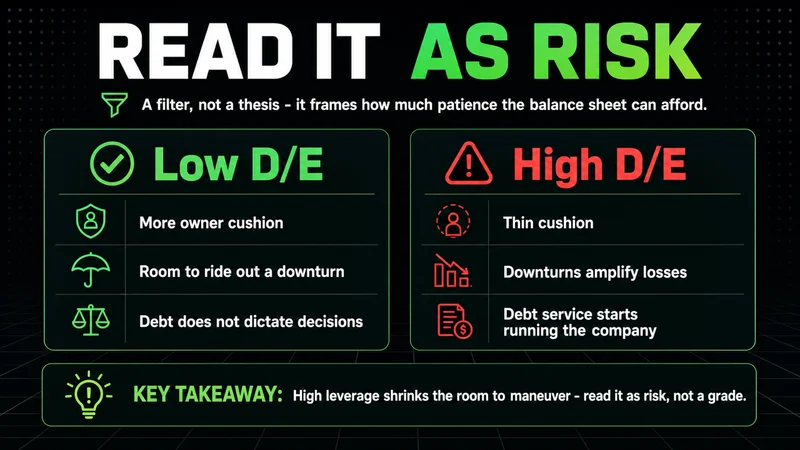
For a position trader, the ratio is a filter, not a thesis. It frames how much patience the balance sheet can afford before debt service starts dictating decisions for management.
A few ways it informs the read:
A high ratio raises the stakes on every earnings miss, because the company has less margin before covenants and interest coverage come into focus.
A rising ratio paired with falling margins is a combination worth respecting, since leverage amplifies both good outcomes and bad ones.
A very low ratio is not always a compliment. It can signal a management team leaving cheap capital unused, which equity holders sometimes penalize.
The ratio is context, not a signal on its own. Trading without context is gambling with better vocabulary, and a leverage number read in isolation is exactly that kind of context-free bet. It tells you how a stock might behave when conditions tighten; it does not tell you when to buy or sell.
Where the debt to equity ratio breaks down
The metric stays clean only while the inputs are clean. Several common situations distort it, and reading the number without checking for them is how analysts get surprised.
Negative equity makes the ratio meaningless. After years of losses or large debt-funded buybacks, equity can turn negative, and dividing by a negative denominator produces a number that looks fine or absurd but describes nothing real.
Aggressive share buybacks shrink the equity base directly. A company can push its ratio higher purely by returning capital, with no change in the underlying business.
Off-balance-sheet leverage, operating commitments, and other obligations may not show up cleanly in liabilities, which understates the true burden.
This is the honest limitation. The ratio works while equity is positive and the balance sheet captures the real obligations. Outside those conditions, the same formula returns a number that quietly lies, and it should be set aside rather than trusted.
FAQs
What is a good debt to equity ratio? There is no single answer. Below 1.0 is generally seen as conservative and above 2.0 invites scrutiny, but the only meaningful benchmark is the company's own industry. A utility at 2.0 and a software firm at 2.0 are not the same risk.
Can the debt to equity ratio be negative? Yes, when shareholders' equity is negative, usually after sustained losses or large debt-funded buybacks. A negative reading does not describe a real proportion of debt to equity, so treat it as a flag to investigate the balance sheet rather than a number to interpret.
What is the difference between the debt to equity ratio and the debt ratio? The debt to equity ratio divides total liabilities by shareholders' equity. The debt ratio divides total liabilities by total assets. Both measure leverage, but the debt ratio frames obligations against everything the company owns, while debt to equity frames them against the owners' stake specifically.
Worth the read?


