
Debt Ratio — Formula, Meaning, and How to Read It
The debt ratio is total liabilities over total assets. Learn the formula, how to interpret it, and what counts as a good debt ratio across industries.

The debt ratio is total liabilities divided by total assets. It tells you what fraction of a company is financed by debt rather than by equity. A ratio of 0.40 means 40 percent of every asset on the books was funded by someone the company owes. That single number is one of the fastest reads on solvency you can get from a balance sheet.
Most explanations stop at the formula. The number matters less than the context around it. A debt ratio is a snapshot of structure, not a verdict, and treating it as a pass-or-fail score is where most beginners go wrong.
What the debt ratio actually measures
The debt ratio measures financial leverage. It answers one question: how much of the company's asset base is claimed by creditors before shareholders see anything.
Total liabilities include everything the company owes, both short-term and long-term. Current liabilities like accounts payable and accrued expenses sit alongside long-term obligations like bonds and term loans. Total assets cover the entire left side of the balance sheet, from cash to inventory to property and equipment.
A higher debt ratio means more of the business runs on borrowed capital. A lower ratio means more of it is funded by owners. Neither is automatically good or bad. The structure has to match the business.
The debt ratio formula and how to calculate it
The debt ratio formula is straightforward:
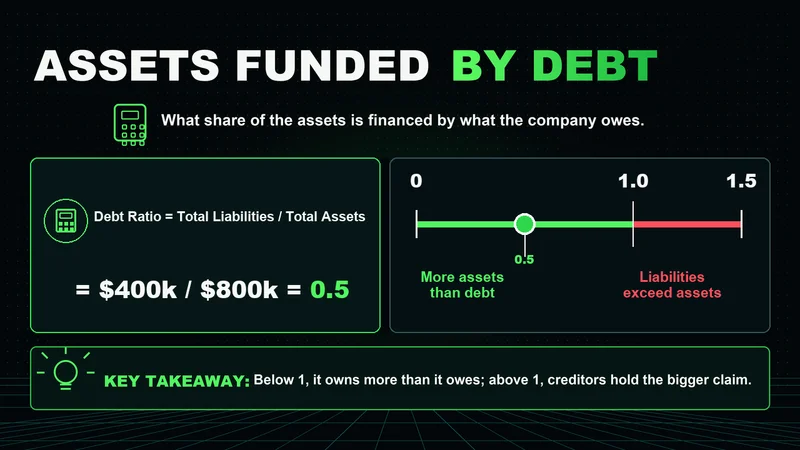
Debt Ratio = Total Liabilities / Total Assets
Both inputs come straight off the balance sheet. To calculate the debt ratio, follow three steps:
- Find total liabilities on the balance sheet, combining current and long-term obligations.
- Find total assets, which is the sum of everything the company owns.
- Divide liabilities by assets. Multiply by 100 if you want a percentage.
Consider a company with 4 million dollars in total liabilities and 10 million dollars in total assets. The debt ratio is 4 divided by 10, or 0.40. Forty percent of its assets are debt-financed. The arithmetic never gets harder than that, which is part of the point. The discipline is in reading the result, not computing it.
How to interpret the debt ratio
Interpretation is where the number earns its keep. A debt ratio below 1 means the company holds more assets than debt. Above 1 means liabilities exceed assets, which signals that creditors have a larger claim on the business than the owners do.
The rough conventions look like this:
| Debt ratio | General read |
|---|---|
| Below 0.40 | Conservative; low leverage, more equity-funded |
| 0.40 to 0.60 | Moderate; common for established firms |
| Above 0.60 | Aggressive; heavier reliance on borrowed capital |
| Above 1.00 | Liabilities exceed assets; elevated solvency risk |
These bands are a starting point, not a rule. A utility with stable, regulated cash flows can carry a debt ratio that would be dangerous for a cyclical manufacturer. The same 0.65 reads as routine in one industry and as a warning in another. Context decides.
What counts as a good debt ratio
Investors generally want to see a debt ratio between 0.30 and 0.60, with the room to maneuver that staying under 0.60 provides. But a good debt ratio is the one that fits the business model, the industry, and the stage of the company.
A few things shift the benchmark:
- Capital-intensive industries like utilities, telecom, and real estate tolerate higher ratios because their assets and cash flows are stable and financeable.
- Asset-light businesses like software run lower ratios because they have little to borrow against and little need to.
- Early-stage and rapidly expanding companies often carry elevated debt while they build out, which is not the same as distress.
A debt ratio is a question, not an answer. The job is to ask why the structure looks the way it does, not to grade it against a fixed number.
How investors use the debt ratio in practice
In a screening pass, the debt ratio is a filter, not a thesis. It narrows the field before deeper work begins. A trader scanning a watchlist uses it to flag balance sheets that need a closer look, then moves to coverage ratios, free cash flow, and the maturity schedule to understand whether the debt is actually a problem.
The metric becomes far more useful when you compare it three ways:
- Against the company's own history, to see whether leverage is climbing or being paid down.
- Against direct competitors in the same industry, to see whether the structure is normal or an outlier.
- Against the cost and timing of the debt, because a high ratio with cheap, long-dated, well-covered debt is a different animal than a high ratio with expensive paper coming due next year.
This is the part beginners skip. The ratio gets treated as the conclusion when it should be the prompt for the next question. Numbers without context are gambling with better vocabulary.
Where the debt ratio breaks down
The debt ratio is clean on the surface and quietly misleading underneath. It works while the balance sheet tells the whole story. The moment material obligations sit off the balance sheet, the same number means almost nothing.
Operating leases, pension shortfalls, and contingent liabilities can leave a company with real obligations that the reported debt ratio understates. Two firms can show an identical 0.45 while one carries large off-balance-sheet commitments the metric never sees. The ratio also says nothing about whether the company can actually service its debt. A business can run a low debt ratio and still be squeezed if its cash flow is weak or its maturities are badly timed.
That is the limitation worth internalizing. The debt ratio describes structure at a single moment. It does not measure the ability to pay, the quality of the assets, or the obligations hiding in the footnotes. Pair it with coverage ratios and a look at the cash flow statement, or the number flatters a balance sheet that does not deserve it.
Debt ratio vs debt-to-equity ratio
These two get confused constantly because they measure the same leverage from different angles. The debt ratio compares liabilities to total assets. The debt-to-equity ratio compares liabilities to shareholder equity.
The debt ratio answers what share of the assets is debt-funded. The debt-to-equity ratio answers how many dollars of debt back each dollar of equity. They move together but are not interchangeable, and debt-to-equity tends to swing harder because equity is a smaller, more volatile base than total assets. Read alongside each other, they give a fuller picture of how a company is capitalized than either does alone.
FAQs
What is a good debt ratio? There is no universal number, but investors generally look for a debt ratio between 0.30 and 0.60. Below 0.40 is conservative, and above 0.60 leans aggressive. What counts as good depends on the industry, the stability of cash flows, and the company's stage.
What does a debt ratio above 1 mean? It means total liabilities are greater than total assets, so creditors have a larger claim on the company than the owners do. That signals elevated solvency risk, though it can be temporary for a company working through a heavy investment phase.
How is the debt ratio different from the debt-to-equity ratio? The debt ratio divides total liabilities by total assets. The debt-to-equity ratio divides total liabilities by shareholder equity. Both measure leverage, but debt-to-equity tends to swing harder because equity is a smaller, more volatile base.
Can the debt ratio be misleading? Yes. It ignores off-balance-sheet obligations like operating leases and pension gaps, and it says nothing about whether cash flow can cover the debt. Always pair it with coverage ratios and the cash flow statement before drawing a conclusion.
The short version
The debt ratio is total liabilities over total assets, and it tells you how much of a company runs on borrowed money. Below 0.40 is conservative, 0.40 to 0.60 is common, and above 0.60 leans aggressive, but the band only means something against the industry and the company's own history. Use it as a filter, not a verdict. Then check coverage, cash flow, and the footnotes before you trust the number, because structure on its own never tells you whether a company can actually pay.
Worth the read?


