
Equilibrium Price — What It Is and How Markets Find It
Equilibrium price is the level where supply and demand clear. Here is how markets find it, how to calculate it, and where the textbook model breaks down.
The equilibrium price is the price at which quantity demanded equals quantity supplied — the level where buyers take exactly what sellers offer and the market clears. That is the textbook definition, and it is accurate. What the textbook leaves out is that in a live market, this point never holds still.
Most explanations stop at two curves crossing on a graph. That picture is useful for an exam and incomplete for anyone watching a real order book. Price does not sit at equilibrium; it searches for it, finds it briefly, and then conditions change and the search starts again. Understanding both versions — the static model and the moving target — is what makes the concept worth your time.
What is the equilibrium price?
The equilibrium price meaning is simple at its core: it is the single price where the amount buyers want to purchase matches the amount sellers want to sell. No unsold surplus, no unmet shortage. Economists call it the market-clearing price because every willing transaction at that level gets done.
The mechanics behind it are pressure and release. Hold price above equilibrium, and sellers offer more than buyers absorb — unsold supply builds and pressures price lower. Hold price below it, and demand outruns supply — shortages appear, and competing buyers bid price back up. The equilibrium price is the level where those two pressures cancel.
Alfred Marshall, who formalized supply and demand analysis more than a century ago, made the point that neither side sets value alone:
"We might as reasonably dispute whether it is the upper or the under blade of a pair of scissors that cuts a piece of paper, as whether value is governed by utility or cost of production." — Alfred Marshall, Principles of Economics
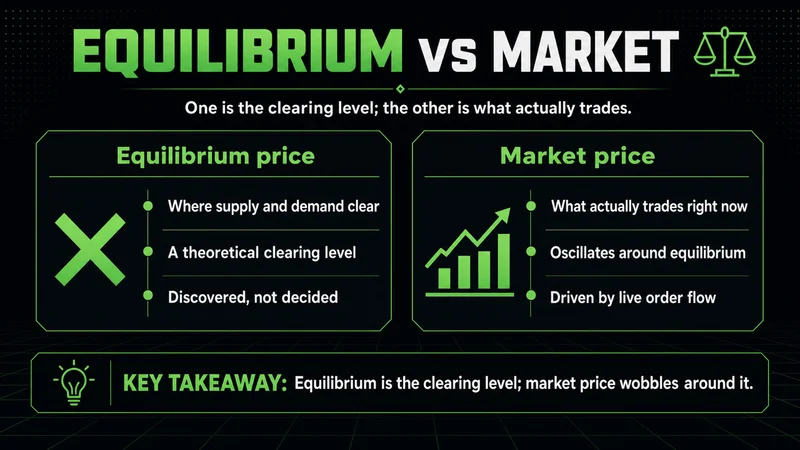
Both blades cut. Both sides of the market set the equilibrium price. The useful mental model for beginners: equilibrium is not a price anyone decides. It is a price the market discovers through constant negotiation between supply and demand.
Equilibrium price vs. market price
These two terms get used interchangeably, and they should not be. The market price is whatever the last transaction printed. It exists every second the market is open. The equilibrium price is where price would settle if supply and demand conditions froze long enough for the market to fully clear.
The market price oscillates around the equilibrium; it rarely sits on it. Orders arrive unevenly, information spreads unevenly, and large participants move size in pieces. The result is constant overshoot and correction around a level that is itself drifting.
The practical distinction: market price is observable, and equilibrium price is inferred. You can watch where price trades and, more importantly, where it keeps returning and spending time. That area of acceptance is the market's current estimate of equilibrium — the closest thing to a measurable version of the concept.
How to find the equilibrium price — a worked example
In a classroom setting, finding the equilibrium price takes three steps:
- Write the demand function — for example, Qd = 200 − 4P.
- Write the supply function — for example, Qs = 6P − 100.
- Set them equal and solve for P.
Setting 200 − 4P equal to 6P − 100 gives 300 = 10P, so P = 30. At a price of 30, quantity demanded is 200 − 120 = 80, and quantity supplied is 180 − 100 = 80. The market clears at 80 units. The same answer shows up in a supply and demand schedule:
| Price | Quantity demanded | Quantity supplied | Market condition |
|---|---|---|---|
| 20 | 120 | 20 | Shortage — price pressured up |
| 25 | 100 | 50 | Shortage — price pressured up |
| 30 | 80 | 80 | Equilibrium — market clears |
| 35 | 60 | 110 | Surplus — price pressured down |
| 40 | 40 | 140 | Surplus — price pressured down |
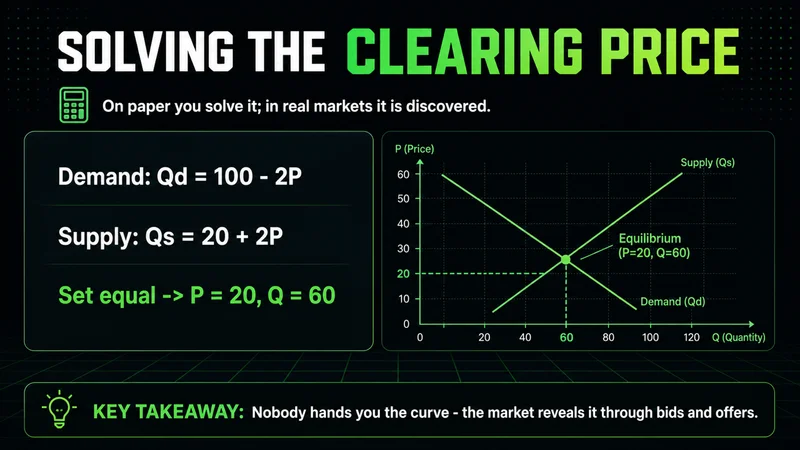
This equilibrium price example is clean because the functions are handed to you. In a real market, nobody hands you the demand curve. The inputs reveal themselves only through behavior — bids, offers, and completed transactions — which is why the concept ends up mattering more than the calculation for most investors.
How does equilibrium price work in the stock market?
A stock exchange runs a continuous auction. The order book is the supply and demand schedule, updating in real time: resting bids are demand at each price, resting offers are supply. When buying and selling pressure match, price stops trending and starts rotating — the auction has found a temporary equilibrium.
On a chart, that balance is visible without any economics:
- Price rotates inside a defined range instead of trending.
- Volume builds near the center of the range, where most two-sided trade happens.
- Probes toward the edges of the range get rejected and return toward the middle.
Traders who work with market structure call these balance areas, or areas of acceptance. The center of that rotation is the working equilibrium — the price where the most business gets done because both sides consider it fair enough to transact.
Exchanges make the concept literal twice a day. The opening and closing auctions collect every order submitted for that session, then compute the single price that matches the maximum number of shares — a market-clearing calculation, run by the matching engine. The opening print and the closing print are, in the strictest sense, equilibrium prices: the levels where aggregated supply and demand crossed at that moment. Everything between the two is the continuous, messier version of the same process.
This is also how equilibrium price affects stock prices day to day. When new information arrives — an earnings release, a rate decision, a large institutional order — the old equilibrium stops being valid. Price displaces, searches, and begins building acceptance somewhere else. The stock market effect of equilibrium is not stability; it is constant migration between temporary points of balance.
Why equilibrium price matters for investors
For investors, equilibrium thinking changes the questions you ask. Instead of "is this price high or low," the better question is "is this price being accepted or rejected." A stock holding above a prior balance area on steady volume is telling you the market has repriced. A stock that spikes and immediately returns to its old range is telling you the move found no acceptance.
The concept also explains market impact. A large buy order does not simply fill at the current price; it consumes the available supply near equilibrium and pushes price into levels where new sellers must be found. That is why institutions work orders in pieces — moving size at a fair price requires the equilibrium to hold while they execute.
Practical signals worth tracking:
- Time spent at a level. The longer price holds an area, the stronger the evidence of balance.
- Reaction after a breakout. Acceptance above the old range supports a new equilibrium; a fast rejection suggests the old one still governs.
- Volume location. Heavy volume at the extreme of a move often marks the search for a new equilibrium, not the end of it.
None of these signals predict. They describe where balance is and when it is breaking, which is the realistic ceiling for what equilibrium analysis offers an investor.
Where the equilibrium model breaks down
The textbook model carries assumptions that live markets do not honor. Knowing the equilibrium price limitations matters as much as knowing the definition:
| Textbook assumption | Live market reality |
|---|---|
| Curves are stable and known | Supply and demand shift constantly and are never directly observable |
| Participants share the same information | Information arrives unevenly and gets priced in at different speeds |
| Liquidity is always available | Order books thin out overnight, around news, and in stressed conditions |
| One equilibrium exists | Markets migrate between temporary balance areas |
The liquidity assumption fails hardest. Balance reads cleanly on a liquid index during regular cash hours, when the book is deep and two-sided. Overnight, on a thin book, the same rotation around a midpoint means almost nothing — a single modest order can sweep several levels, and the equilibrium you mapped disappears on contact. If the participation is not there, the balance was never real.
News creates a similar trap. The first move after a major release is often positioning unwinding, not a new consensus about value — price displaces, runs the obvious stops, and then builds its actual new balance somewhere quieter. Treating the first print after news as the new equilibrium is one of the more common equilibrium price mistakes beginners make.
Other errors that follow from the model's limits:
- Treating equilibrium as a fixed level rather than a moving area.
- Assuming price must return to a calculated fair value on any timeframe that matters.
- Reading balance built on thin volume as if it carried the same weight as balance built on heavy participation.
An equilibrium price checklist for reading balance
A short equilibrium price checklist for market analysis, usable on any liquid stock or index:
- Mark where price has spent the most time and traded the most volume — that area is the working equilibrium.
- Note whether the current price is inside that area (balance) or outside it (search).
- If outside, watch for acceptance: time plus volume holding at the new level.
- Treat fast rejections back into the old area as evidence the old equilibrium still governs.
- Check conditions: deep, two-sided sessions make balance readable, while thin sessions make it noise.
- Reassess after every major scheduled release — equilibrium does not survive new information.
The summary version: the equilibrium price is where supply and demand clear. In a textbook, it is a solved intersection. In the stock market, it is a temporary area of acceptance that forms, holds, and migrates. The model will not tell you where price goes next. It tells you where the market last agreed on value and whether that agreement is holding — and for most investors, that is the more useful piece of information anyway.
Worth the read?


