
Trading Volume Explained — How to Read It on a Chart
Trading volume is the participation behind every price move. Learn what volume confirms, how to read it on a chart, and when it stops working.
Volume is the number of shares or contracts that change hands over a set period, and it tells you how many participants stood behind a price move. Price shows you where the market went. Volume shows you whether anyone of size actually agreed with the move. Read together, they answer a question a price chart alone cannot: was that push real, or was it a few orders drifting through a quiet book?
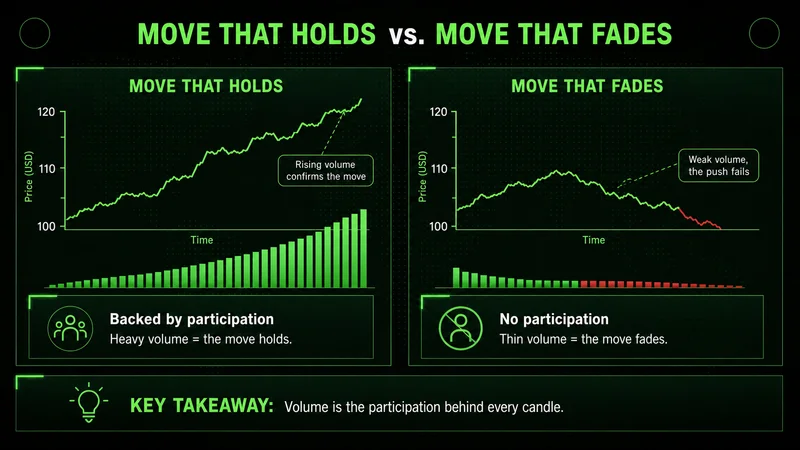
Most beginners treat volume as a secondary detail, a bar at the bottom of the screen they glance at after the fact. That habit is backward. Volume is the participation behind every candle, and participation is what separates a move that holds from a move that fades.
What is volume in trading?
Volume in trading is a count of activity, not a measure of direction. One contract traded means a buyer and a seller met at a price; volume tallies how many of those meetings happened in a bar, an hour, or a session. For stocks it is counted in shares. For futures and options it is counted in contracts.
The number on its own is neutral. A reading of 2 million shares means nothing until you compare it to what that instrument normally does. This is the part most explanations skip. Volume is always relative. The same absolute figure can be heavy on a small-cap name and invisible on a large-cap index. The reference point is the asset's own recent average, not a universal threshold.
When you frame volume as relative participation, the rest of the concept falls into place. High volume means more participants agreed it was worth transacting at those prices. Low volume means few did. Everything else builds on that.
How to identify volume on a chart
On nearly every platform, volume sits as a histogram along the bottom of the price chart. Each bar lines up under its candle and shows how much traded during that period. Taller bars mean heavier participation. Many platforms color each bar to match whether the candle closed up or down, which gives you a fast read on where the activity leaned.
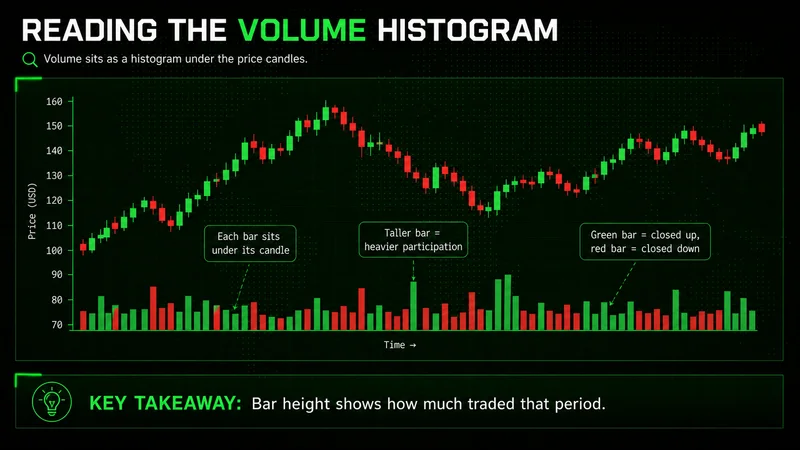
To read it with any precision, add a moving average to the volume itself, usually a 20-period line. That line is your baseline. Now every bar tells you something useful at a glance:
- A bar well above the average line marks a session where participation surged.
- A bar sitting under the line marks a quiet, low-conviction period.
- A cluster of above-average bars shows sustained interest, not a one-off spike.
The relative average is the entire point. Without it you are staring at raw numbers with no context. With it, you can see in one second whether the current bar is normal, heavy, or thin for this specific instrument.
What volume actually confirms
Volume confirms conviction behind a price move. It does not predict direction, and treating it as a forecasting tool is the first mistake most traders make. The honest framing is that volume validates or questions what price is already doing.
The core relationships are straightforward once you stop expecting them to call the future:
- Price rising on rising volume shows buyers are committed, and the move has participation behind it.
- Price rising on falling volume shows the advance is thinning out, even while it prints new highs.
- A breakout on heavy volume carries more weight than the same breakout on light volume.
- A breakout on thin volume frequently fails, because there was never much agreement to begin with.
That third and fourth point is where volume earns its place in technical analysis. Most breakouts fail because traders enter emotionally instead of structurally, chasing the candle without checking whether anyone showed up to support it. A level that breaks on a quiet book is a level that can reclaim just as easily. The participation simply was not there to defend it.
This is the difference between volume and price action. Price action describes the structure, the swing highs and lows, the way candles form. Volume tells you how much real interest is behind that structure. When the two agree, the read is cleaner. When price makes a new high but volume drops off, the structure is intact while the conviction is leaking, and that divergence is worth respecting.
How to confirm volume before entering a trade
Confirmation is a process, not a glance. Before you act on a setup, run volume through a short sequence so you are reacting to participation rather than to a hopeful candle. This is the checklist I keep in front of me:
- Compare the current bar to the 20-period volume average. Is participation above normal, or is the book thin?
- Check whether volume expanded in the direction of the move, not against it.
- On a breakout, require the breaking bar to trade meaningfully above average before you treat the level as broken.
- Watch the first pullback. Healthy continuation usually pulls back on lighter volume, not heavier.
- If volume is flat or declining into your entry, downgrade the setup or stand aside.
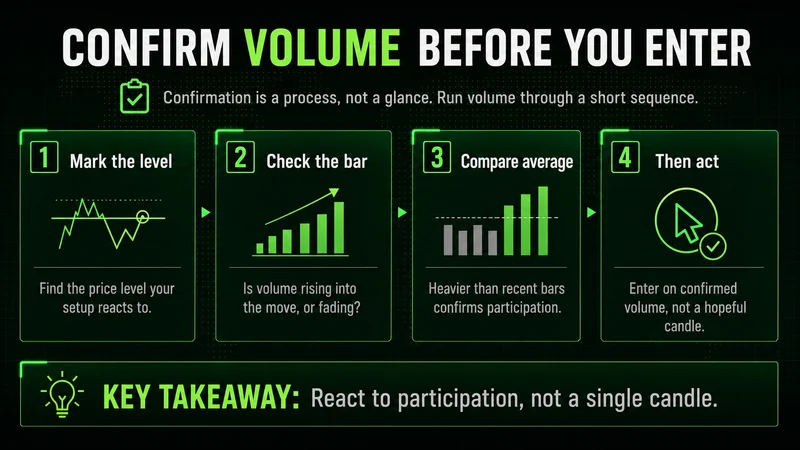
None of these steps predict the outcome. They filter for participation, which is all volume can honestly offer. A setup that clears every step still loses sometimes, because the market is probabilistic. What the sequence does is keep you out of the low-conviction trades that look identical to good ones on a price chart alone. Over enough repetitions, that filter is the edge.
The best timeframe for volume analysis
There is no single best timeframe for volume analysis. The right one matches how you trade. Volume is fractal in a sense, the same participation logic applies whether you are reading a one-minute bar or a daily one, but the noise level changes sharply between them.
A few practical anchors:
- Intraday traders lean on lower timeframes, where session structure and the open and close drive participation in predictable ways.
- Swing traders favor the daily, where a single bar summarizes a full session and average comparisons are more stable.
- Whatever timeframe you trade, read volume on the same one you make decisions on, and use a higher one only for context.
The mistake is mixing them carelessly, judging a one-minute entry against daily volume norms. The two are not comparable. Keep your participation read and your decision timeframe aligned, and volume becomes far easier to interpret.
Common volume mistakes beginners make
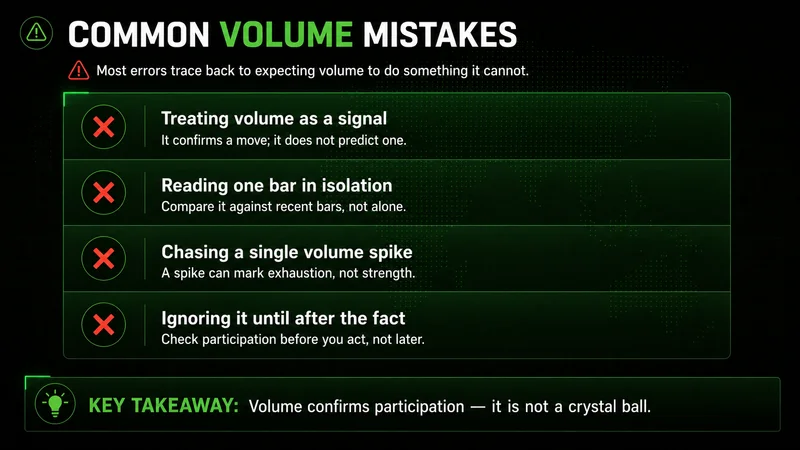
The errors are consistent, and most trace back to expecting volume to do something it cannot.
- Reading the raw number without comparing it to the asset's own average. Context is the whole game.
- Treating high volume as automatically bullish. Heavy participation can mark aggressive selling just as easily as buying.
- Using volume to predict instead of to confirm. It validates a move; it does not call one in advance.
- Ignoring where volume appears in the structure. The same heavy bar means different things at a breakout, at a top, and inside a range.
- Trusting reported volume on instruments where the data is fragmented, which brings us to where this whole framework starts to break down.
When volume reads break down
Volume analysis works cleanly in liquid markets during active hours, and it degrades fast outside of them. This is the part that gets left out of most beginner guides, and it matters more than any single signal.
In thin overnight sessions, a handful of contracts can produce a volume bar that looks meaningful and means almost nothing. The same breakout that would demand respect during the cash session can be a few resting orders filling on an empty book after hours. Read those bars the same way and you will get faked out repeatedly.
Index rebalance days and futures roll periods distort the picture further. Volume spikes on those days reflect mechanical flow, funds reshuffling holdings or traders rolling contracts forward, not directional conviction. The bar is huge, but it is not telling you what a normal heavy bar tells you. Treat scheduled mechanical volume as noise, not signal.
Spot foreign exchange has no centralized tape at all, so any volume figure there is tick volume from one broker, a proxy rather than true participation. It can still be useful as a relative measure, but it is not the same instrument as exchange-reported volume, and pretending otherwise leads to bad conclusions. The honest position is that volume is a strong tool inside its operating conditions and a misleading one outside them. Knowing the difference is most of the skill.
FAQs
What is volume in trading in simple terms? It is the number of shares or contracts traded over a given period. It measures how much participation stood behind a price move, not which way the market will go next.
How do I read volume on a chart? Volume appears as a histogram under the price candles, with each bar matching its candle. Add a 20-period moving average to the volume so you can tell at a glance whether the current bar is heavy, normal, or thin for that instrument.
Does volume predict price direction? No. Volume confirms conviction behind a move that is already happening. It is a validation tool, not a forecasting one, and treating it as predictive is a common early mistake.
Is high volume always bullish? No. Heavy participation can mark aggressive selling as easily as aggressive buying. High volume tells you many participants were involved; it does not tell you which side won.
How do I confirm volume before entering a trade? Compare the current bar to its average, check that volume expanded in the direction of the move, and on a breakout require the breaking bar to trade above average. If participation is flat or declining into your entry, downgrade the setup.
What is the best timeframe for volume analysis? The one you make decisions on. Intraday traders read lower timeframes; swing traders favor the daily. Keep your volume read and your decision timeframe aligned, and use a higher one only for context.
How does volume relate to risk? Low participation means thinner liquidity, which means wider slippage and weaker follow-through. Entering on thin volume raises the odds that a move reverses against you before it develops, so it directly affects your risk exposure.
Why does volume sometimes give false signals? Because it breaks down outside liquid, active hours. Thin overnight sessions, index rebalance days, and futures roll periods all produce volume that looks meaningful but reflects mechanical flow rather than conviction.
The short version
Volume is participation, and participation is context for everything price does. Read it relative to the asset's own average, use it to confirm rather than predict, and respect the conditions where it stops working. The traders who get the most from volume are not the ones with the most indicators. They are the ones who know the difference between a heavy bar that means something and a heavy bar that does not. If you want more breakdowns like this, follow along for the next one.
Worth the read?


