
Head and Shoulders Pattern — Confirmation Over Recognition
The head and shoulders pattern marks a possible trend reversal, but the shape alone is not a signal. What confirmation requires and where the pattern fails.
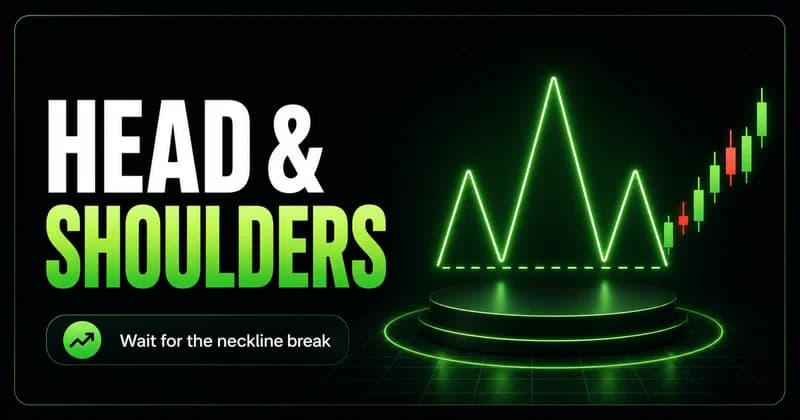
The head and shoulders pattern is a reversal formation — three peaks with the middle one highest — that signals a possible end to an uptrend when price breaks the neckline drawn under the two troughs between those peaks. That is the definition. The part that decides whether the pattern makes you money is everything that happens after you recognize it.
Most traders learn this shape in their first month and misuse it for years. Seeing it is easy. Waiting for confirmation is not. This guide covers what the formation means, how to identify it on a chart, what an actual trading signal looks like, and the conditions where the pattern quietly stops working.
What the head and shoulders pattern actually means
Strip the name away and the pattern is a record of demand failing. Price rallies and pulls back — the left shoulder. Buyers push to a new high, then give it back — the head. A third rally stalls below that high — the right shoulder. The line connecting the two pullback lows is the neckline, and it is the only level in the structure that matters for execution.
Left shoulder — a rally to a high followed by a pullback. On its own it means nothing; healthy uptrends print these constantly.
Head — a push above the left shoulder's high that fails to hold and retreats to the same support area. This is the first sign buyers are paying more and getting less.
Right shoulder — a weaker rally that stalls below the head. Demand could not even retest the prior high, and that lower high is the structural tell.
Neckline — the line under the two troughs. It can be flat, ascending, or descending. What matters is whether price accepts below it.
The meaning sits in the sequence, not the silhouette. A market that prints a lower high after a failed push into prior highs is a market where positioning has changed. The head and shoulders pattern is simply the most recognizable way that change draws itself on a chart. The inverse version — three troughs with the middle one lowest — tells the same story in reverse at the end of a downtrend.
How to identify a head and shoulders pattern on a chart
Identification fails more often from impatience than from eyesight. Traders start hunting for the shape in any sideways chop, but the pattern only carries weight in context: there has to be an established uptrend worth reversing. Without that, three bumps on a chart are just three bumps.
Confirm the prior trend. Look left. If price was not in a sustained advance before the formation, there is nothing for the pattern to reverse.
Mark the swing structure. A high, a higher high, then a lower high. If the middle peak does not clearly stand above both shoulders, the read is forced.
Draw the neckline through the two troughs. A sloped neckline is acceptable. A neckline you have to redraw three times to make the pattern appear is not.
Check the volume signature. In cleaner formations, participation tends to fade as the head forms and fade again on the right shoulder — the advance is running out of sponsorship before the break ever happens.
A practical example for traders: on a daily stock chart, a left shoulder and head might build over several weeks, with the right shoulder forming on visibly lighter volume. The structure is readable well before the neckline gives way. Your job at that stage is observation, not anticipation.
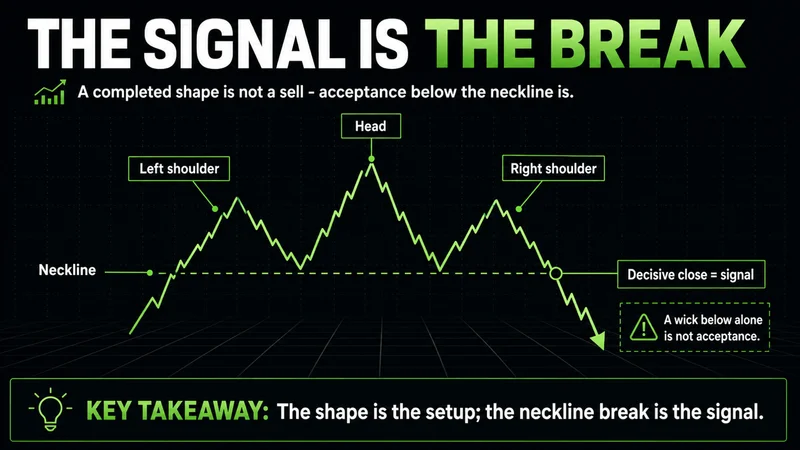
The trading signal is the neckline break — not the shape
A completed-looking head and shoulders chart pattern is not a sell signal. The trading signal is acceptance below the neckline, and acceptance has specific ingredients:
A decisive close below the neckline on the timeframe you trade. A wick through the level that closes back above it is rejection, not a break.
Displacement, not drift. Price should expand through the level with momentum. A slow leak below the neckline on shrinking range is the kind of break that reverses.
No immediate reclaim. If price breaks, then trades back above the neckline and holds there, the pattern has failed — regardless of how clean the shape was.
Some traders wait for a retest of the broken neckline before entering. The trade-off is honest: you get a tighter stop and a clearer invalidation, and you sometimes watch the move leave without you. Both approaches work when applied consistently. Switching between them based on mood is how the pattern's edge disappears.
There is no head and shoulders pattern indicator that replaces this judgment. Scanners can flag the shape, and volume or momentum tools can add context around the break, but no overlay can tell you whether the move is happening into real participation or into a thin book. Confirmation is a read, not an alert.
For targets, the conventional measured move projects the distance from the head to the neckline below the break point. Treat it as a reference for whether the trade offers enough room relative to your risk — not as a promise. And define invalidation before entry: a reclaim of the neckline with acceptance ends the idea, and the exit should be mechanical when it happens.
"It never was my thinking that made the big money for me. It always was my sitting." — Jesse Livermore
The sitting applies before the trade, too. Waiting for the close, the retest, or the failed reclaim is where most of this pattern's reliability actually lives.
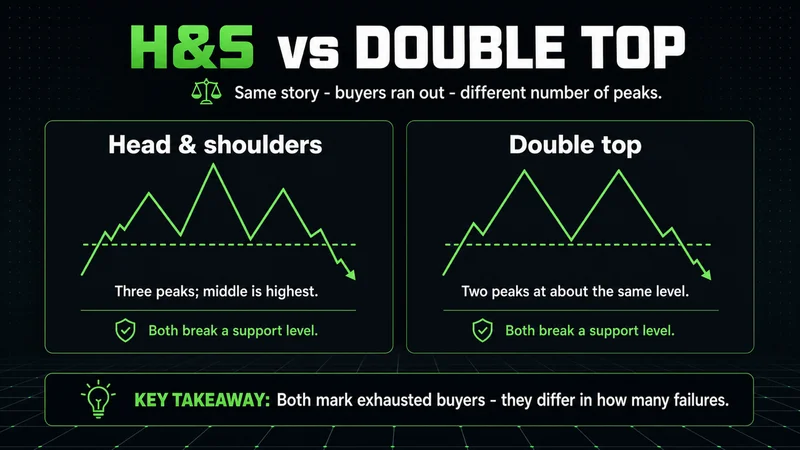
Head and shoulders pattern vs double top — same failure, different evidence
Both patterns describe an advance that ran out of buyers, and both resolve through a broken support level. The differences are practical, not cosmetic:
Number of failures. A double top makes two highs at roughly the same level. The head and shoulders makes three peaks, and the third one fails lower — an extra data point of weakening demand.
The built-in lower high. The right shoulder is a lower high by definition. A double top does not give you that evidence until after its support breaks.
The trigger level. A double top breaks a single trough. The head and shoulders breaks a neckline drawn across two, which often makes the level more widely watched — and more crowded.
In live conditions the two formations blur into each other more than textbooks admit. A double top with a weak third push becomes a head and shoulders depending on where you squint. If you find yourself debating the label, the label is the wrong question. A lower high plus broken support reads bearish either way; the structure matters, the name does not.
Where the pattern stops working
Every reversal pattern has a regime that punishes it, and this one is no exception. In a strong momentum trend — the kind where pullbacks stay shallow and every dip gets bought within a session — head and shoulders shapes print constantly and resolve higher. Shorting necklines into that tape is donating liquidity to the next leg up. The pattern needs a market that is actually tiring; it cannot manufacture exhaustion that is not there.
Session context matters just as much. On index futures, a neckline break during regular cash hours, with full participation behind it, is a meaningful event. The same sequence overnight on a thin book means very little — a modest amount of size can draw a textbook break that evaporates at the open. Structure reads cleanly when real participants are present; it degrades fast when they are not.
Failed patterns cut the other way, and aggressively. When a widely watched neckline breaks and price reclaims it quickly, trapped shorts become fuel. Some of the sharpest rallies start exactly there, which is why a failed head and shoulders is information worth acting on rather than a loss worth resenting.
Most breakdowns get sold emotionally instead of structurally — the neckline snap looks urgent, the entry feels late already, and the order goes in without a close, without context, and without a defined invalidation. That entry, not the pattern, is usually what failed.
Timeframe affects all of this. The formation carries more weight on 4-hour and daily charts, where it takes weeks of real positioning to build. On a 1-minute chart the same shape appears dozens of times a day, and most instances are noise.
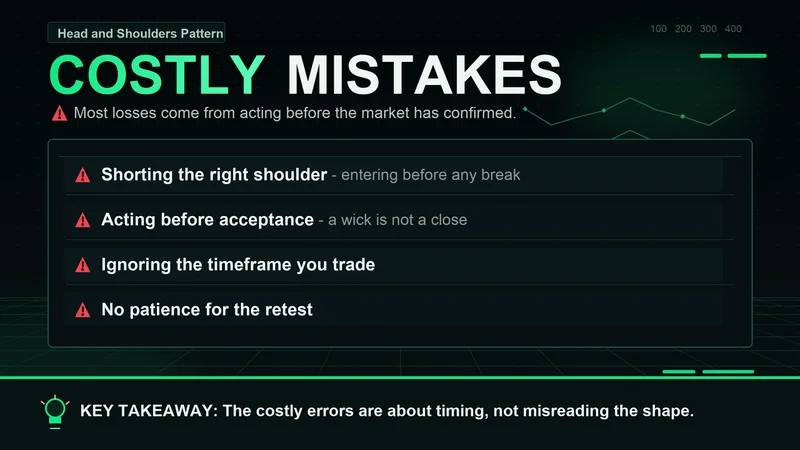
The head and shoulders pattern mistakes that cost the most
The common head and shoulders pattern mistakes beginners make are rarely about misreading the shape. They are about acting before the market has said anything:
Shorting the right shoulder. Entering before any break, on the assumption the pattern will complete. At that point there is no signal — only a forecast.
Treating a wick as a break. Intrabar moves below the neckline that close back above it are rejections. Trading them as confirmations turns a patient setup into a coin flip.
Forcing symmetry. Real formations are rarely textbook. Rejecting valid structure because the shoulders are uneven and redrawing necklines until an invalid one appears are two sides of the same error.
Ignoring the broader trend. A topping pattern on one timeframe can sit inside a powerful uptrend on the next one up. Context decides which read deserves the benefit of the doubt.
Sizing for the measured move. The projection is a reference, not an entitlement. Position size should be built from the stop distance, not from the hoped-for target.
Each of these mistakes shares a root: wanting the trade more than the evidence. The pattern does not reward recognition speed. It rewards the discipline to let the level decide.
A head and shoulders pattern checklist before you take the trade
A checklist sounds beginner-grade, which is exactly why it works — it removes the decision-by-feel that ruins this setup. For new traders especially, running the list beats trusting the eye:
Was there an established uptrend before the formation began?
Does the head clearly stand above both shoulders without creative chart-reading?
Is the neckline drawn through the actual troughs — not adjusted to fit?
Did volume fade into the right shoulder, or is participation still expanding?
Has price closed below the neckline with displacement on your trading timeframe?
Is the invalidation defined — a reclaim and hold of the neckline — and is the stop placed there?
Does the room to the measured-move reference justify the risk at your size?
If any answer is no, there is no trade yet. That is not a missed opportunity. That is the process working.
FAQs
What is a head and shoulders pattern in simple terms? It is a chart formation with three peaks — the middle one highest — that appears after an uptrend. It signals that buyers failed twice to extend the move, and a break below the neckline suggests sellers have taken control.
How do you confirm a head and shoulders pattern before trading? Wait for a decisive close below the neckline with expanding momentum, then make sure price does not immediately reclaim the level. Many traders also want a retest of the broken neckline that holds as resistance before entering.
What is the best timeframe for a head and shoulders pattern? Higher timeframes — 4-hour, daily, and weekly charts — produce more reliable formations because they reflect weeks of real positioning. On very low timeframes the same shape appears constantly, and most instances resolve as noise.
Is the head and shoulders pattern bullish or bearish? The standard formation is bearish — it marks a potential top after an uptrend. The inverse version, with three troughs and the middle one lowest, is bullish and marks a potential bottom after a downtrend.
Can beginners trade the head and shoulders pattern? Yes, and it is a reasonable pattern to learn first because the structure is explicit. The risk for beginners is not identification — it is entering before confirmation. A simple rule of waiting for the neckline close removes most of that risk.
What invalidates a head and shoulders pattern? A reclaim of the neckline with acceptance after the break. If price breaks down, then trades back above the neckline and holds there, the pattern has failed — and failed patterns often power moves in the opposite direction.
Recognition starts the work — it does not finish it
The head and shoulders pattern earns its reputation honestly: it describes a real shift in positioning, and it hands you a precise level to work against. But the shape is the cheapest part of the trade. The neckline close, the absence of a reclaim, the session you are trading in, and the stop you define before entry — that is where the outcome is decided. Find the structure, then let the level do the talking.
Worth the read?


