
False Breakout — What It Is and How to Read It
A false breakout clears a key level, fails to hold acceptance, and snaps back. Learn to read one before you act, not after the break traps you.
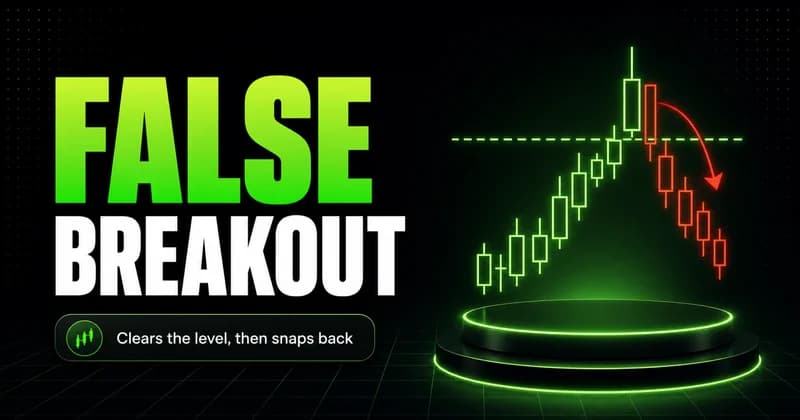
A false breakout is a move that pushes price beyond a key level, fails to hold acceptance there, and snaps back inside the range within a few candles. It looks like the start of a trend and turns into a trap. The level breaks, stops trigger, and then price reverses through the breakout point as if the move never happened. Reading one correctly is less about spotting the break and more about watching what price does in the minutes after it.
Most traders treat the break itself as the signal. That is the mistake. The break is the bait. What matters is acceptance: whether price builds and holds beyond the level, or rejects it and returns. A genuine breakout earns continuation. A false breakout borrows momentum from triggered stops and gives it back almost immediately.
False breakout meaning, in plain terms
A breakout is price clearing a level that previously contained it: a prior high, a range edge, a trendline, a session boundary. A false breakout clears that same level and then fails. The distinction is acceptance. If price closes beyond the level, holds, and continues, the breakout is real. If price pierces the level, prints a rejection, and closes back inside, the breakout was false.
The word false matters. Nothing about the move was random. Liquidity sits in obvious places because most traders place stops and entries in the same obvious places. Pushing a few ticks past resistance triggers that liquidity, and the orders filling those stops give larger participants the volume they need to position the other way. The break was real order flow. The continuation was not there.
Why most breakouts fail before they finish
Most breakouts fail because traders enter emotionally instead of structurally. The level breaks, the candle looks strong, and the entry feels safe precisely because the move is already extended. That is the moment weak positioning enters, and that is the liquidity the move was reaching for.
Context decides whether a break has a future. A break into an area with no opposing liquidity above it can run. A break into a prior high, a higher-timeframe level, or the far edge of a long range is reaching directly into resting orders. The same candle means very different things depending on what sits beyond it. Trading the break without that context is gambling with better vocabulary.
There is also a timing layer. The first move after major news is often not the cleanest opportunity. Volatility spikes pull price through levels on momentum that fades once the initial reaction clears, and a break that looked decisive in the first thirty seconds can be fully reversed before structure has formed.
How to identify a false breakout on a chart
Identification is a sequence, not a single tell. Work through it in order:
- Watch the close, not the wick. A break that holds on a candle close carries more weight than one that only spikes through intrabar. Wicks beyond a level with closes back inside are the clearest rejection footprint.
- Read acceptance after the break. Genuine breaks build a small base beyond the level. False breaks reverse without basing, often within one to three candles.
- Check participation. A break on thin volume into an obvious level is suspect. Conviction shows up as sustained participation, not a single expansion candle.
- Locate the liquidity. Ask what sits just beyond the level. If the answer is a cluster of obvious stops, the break may exist only to reach them.
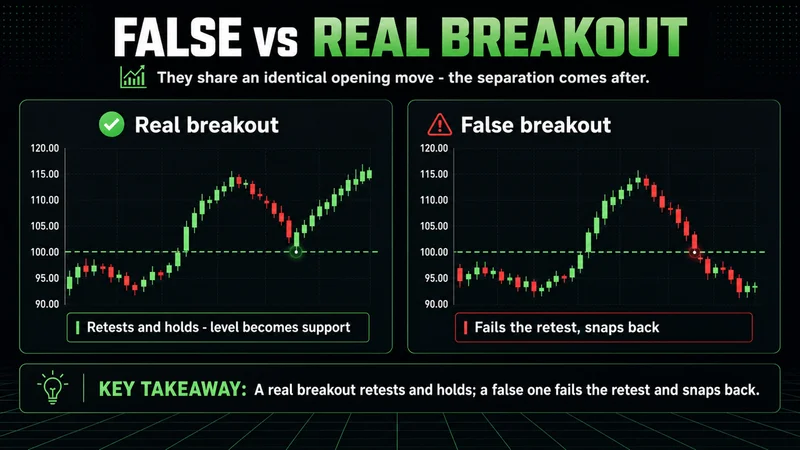
False breakout vs breakout — the line between them
The two patterns share an identical opening move. Price clears a level in both. The separation comes after. A breakout converts the level from resistance to support, retests it, and holds. A false breakout fails the retest, or never builds enough acceptance to attempt one, and trades back through the level it just broke.
This is why confirmation matters more than prediction. You cannot know in advance which one is forming. You can wait for price to declare itself. A confirmed breakout gives a retest entry with defined risk below the reclaimed level. A confirmed false breakout gives a reversal entry once price closes back inside the range, with risk defined beyond the failed extreme. Both are tradable. Neither requires guessing at the moment of the break.
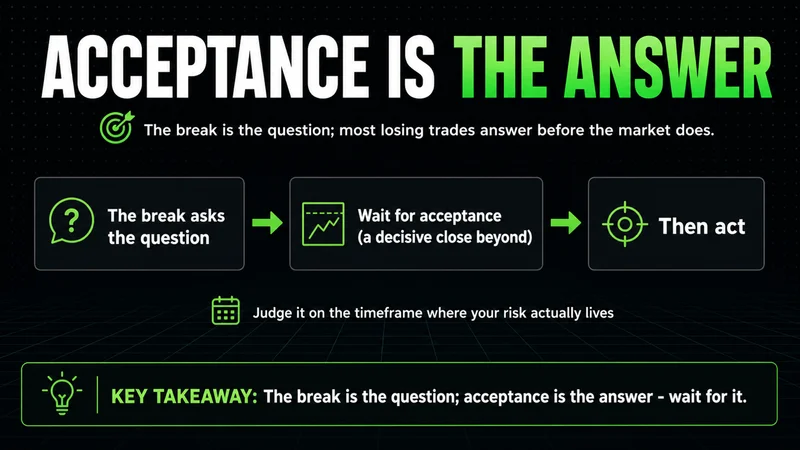
The break is the question the market asks. Acceptance is the answer. Most losing trades come from answering before the market does.
How timeframe changes what a false breakout means
The best timeframe for false breakout analysis is the one that matches where your risk lives. A break that looks false on a one-minute chart can be a healthy pullback inside an intact higher-timeframe trend. The same wick that signals rejection on a five-minute chart may not even register on the hourly.
Structure reads cleanly in liquid cash-session hours. Overnight, on thin liquidity, the same sequence means almost nothing — a level can break and reverse on volume that would not move price at all during the regular session. This is where false breakout logic inverts: outside active hours, the rejection you would normally trust is often just a lack of participants, not a genuine answer from the market.
The practical rule is to define the level on a higher timeframe and read acceptance on a lower one. The higher timeframe tells you which levels matter. The lower timeframe shows you how price behaves once it arrives.
A false breakout checklist before you act
Mistakes cluster around speed. Beginners enter on the break, size up because the move feels obvious, and place stops exactly where the next sweep is headed. The fix is a short routine you run before committing:
- Has price closed beyond the level, or only wicked through it?
- Is there acceptance — a base, a hold — or an immediate reversal?
- What liquidity sits beyond the level, and could the break exist only to reach it?
- Does the higher-timeframe context support continuation, or argue against it?
- Is risk defined at a structural point, not at an arbitrary distance?
The checklist does not predict the outcome. It keeps you from acting before the market has answered, which is where the damage usually starts.
How false breakouts shape your risk
A false breakout is a risk-management event before it is a chart pattern. It is the market showing you exactly where opposing liquidity lives. That information has value whether or not you trade the reversal. The failed extreme becomes a clean invalidation point, and a level that has rejected once tends to matter again.
Risk management matters more than entries here. A reversal entry off a confirmed false breakout, sized so a single loss does not distort the next decision, survives being wrong. A chase into the break, sized up on conviction, does not. The edge in this pattern is not the reversal trade itself. It is the discipline to wait for acceptance and to let the level define your risk instead of your hope.
Where to take this next
False breakouts are one expression of a larger idea: levels matter only in context, and confirmation outranks prediction. If this fit, the natural next steps are studying breakout confirmation in isolation, working through how support, resistance, and trendlines define the levels these breaks test, and tightening position sizing so a failed read costs a small fixed amount rather than a decision-altering one. Read more false breakout examples for beginner traders by pulling up past sessions and marking every break, then labeling which held and which failed. Pattern recognition on this comes from screen time, not from a single explanation.
Worth the read?


