
Fixed Asset Turnover Ratio — How to Read It
The fixed asset turnover ratio shows how much revenue each dollar of fixed assets generates. Here is the formula, a worked example, and how to read it.

The fixed asset turnover ratio measures how much revenue a company generates for every dollar tied up in its property, plant, and equipment. You calculate it by dividing net sales by net fixed assets. A higher number means the asset base is working harder; a lower number means capital is sitting in machinery, buildings, or land that is not yet producing proportional sales. That is the whole idea in one line, but the number only means something once you put it in context.
Most people treat the ratio as a grade. It is closer to a question. A reading of 4.0 tells you sales are four times the net fixed asset base, and nothing more, until you know the industry, the age of the assets, and how the company finances them. Read in isolation, the figure flatters some businesses and unfairly penalizes others.
What the fixed asset turnover ratio actually measures
The fixed asset turnover ratio is an efficiency measure. It isolates one question: how productive is the money the company has committed to long-lived physical assets? Total revenue depends on inventory, receivables, labor, and brand. This ratio strips those out and looks only at the relationship between sales and the fixed asset base.
That focus is the point. A retailer leasing its stores and a manufacturer that owns its plant can post similar revenue and look identical on a total-asset basis, yet behave very differently here. The manufacturer carries a heavy fixed asset base, so its ratio runs lower. The retailer keeps fixed assets light and its ratio runs higher. Neither is automatically better. The ratio is reactive, not predictive. It describes what already happened on the balance sheet and income statement, not what the company will earn next.
The fixed asset turnover ratio formula and a worked example
The formula is direct:
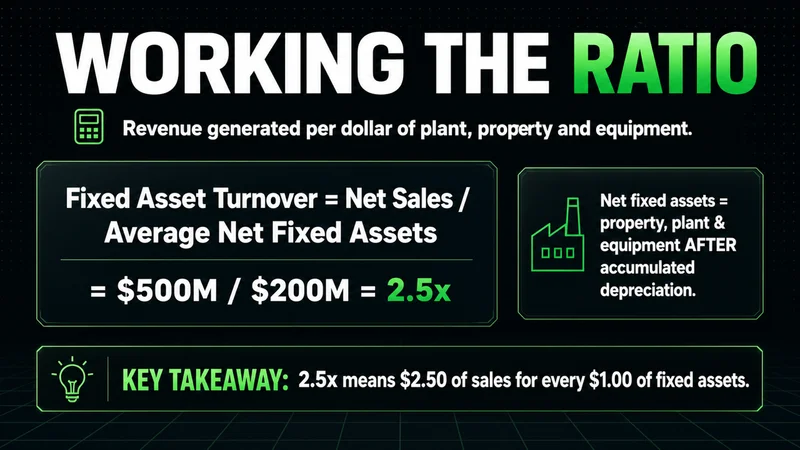
Fixed Asset Turnover Ratio = Net Sales / Average Net Fixed Assets
Net sales is gross revenue minus returns and allowances. Net fixed assets is property, plant, and equipment after accumulated depreciation. Analysts usually average the beginning and ending net fixed asset balances for the period, so a single large purchase or disposal late in the year does not distort the denominator.
Work through a clean example. A company reports net sales of 10 million dollars. Net fixed assets opened the year at 1 million and closed at 1.1 million, so the average is 1.05 million. Divide 10 million by 1.05 million and the ratio is roughly 9.5. For every dollar held in fixed assets, the business produced about 9.50 dollars in sales that year. That is a high reading, consistent with an asset-light operation rather than a capital-intensive one.
The steps stay the same every time:
- Pull net sales from the income statement, not gross revenue.
- Pull net property, plant, and equipment from two consecutive balance sheets.
- Average the opening and closing net fixed asset figures.
- Divide net sales by that average.
How to interpret the ratio, and what counts as a good number
There is no universal good fixed asset turnover ratio. Context sets the bar. The figure that matters is the comparison against direct competitors and against the same company's own history.
A few patterns hold across most cases:
- A rising ratio over several years suggests the existing asset base is generating more sales, which points to better utilization or pricing power.
- A falling ratio can mean recent capital spending has not yet converted into revenue, or that demand softened while the asset base stayed fixed.
- A ratio far above the industry norm can signal an asset-light model, heavy reliance on leasing, or an aging asset base that is nearly depreciated.
Industry is the first filter. Airlines, utilities, and heavy manufacturers carry enormous fixed asset bases, so low single-digit ratios are normal and expected. Software firms, consultancies, and asset-light retailers run far higher because they own little physical capital. Comparing an airline to a software company on this metric tells you nothing useful.
Fixed asset turnover ratio vs total asset turnover ratio
The fixed asset turnover ratio vs total asset turnover ratio question comes up constantly, and the distinction is simple. The fixed asset version uses only net property, plant, and equipment in the denominator. The total asset version uses every asset on the balance sheet, including cash, inventory, and receivables.
Use the fixed asset ratio when you want to judge how well a company deploys its long-lived physical capital, which matters most in capital-intensive industries. Use the total asset ratio when you want a broader view of how the entire asset base supports revenue. The two often move together, but they diverge when a company carries a large cash pile or heavy working capital. A firm can look efficient on fixed assets while a bloated total asset base drags the broader measure down.
Where the ratio lies: leases, asset age, and outsourcing
This is where a clean-looking number stops being trustworthy. The fixed asset turnover ratio breaks down precisely when the asset base on the balance sheet no longer reflects the assets the company actually uses.
Leasing is the clearest case. A company that leases its plant and equipment instead of owning it keeps those assets off the fixed asset line, which shrinks the denominator and inflates the ratio. Two competitors with identical operations can post very different numbers purely because one owns and one rents. Asset age does the same thing quietly. Older assets are heavily depreciated, so net fixed assets fall while sales continue, and the ratio climbs for no operational reason. Outsourcing production has the same effect, moving the capital base onto a supplier's books.
So the ratio works as an efficiency signal only while the balance sheet still carries the assets that generate the revenue. Outside that condition, a high reading can mean a company that genuinely sweats its assets, or one that simply moved them somewhere you cannot see. Reading the figure without checking which case you are in is analysis with better vocabulary, not analysis.
A checklist for reading the ratio in context
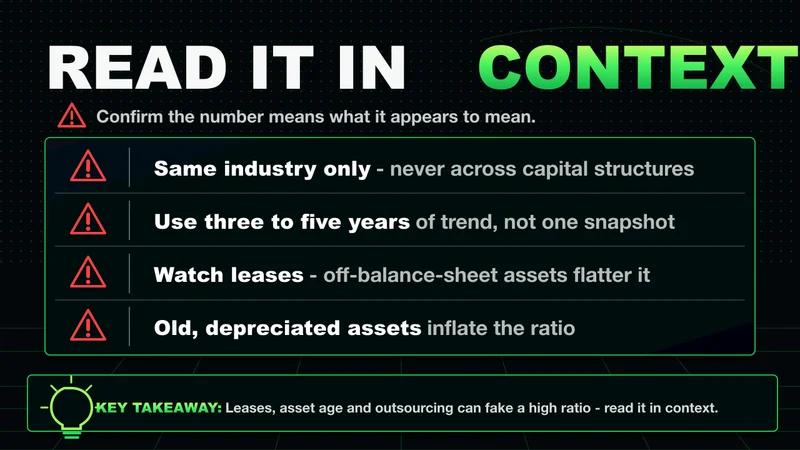
Before you act on a fixed asset turnover ratio, run through a short list. The point is to confirm the number means what it appears to mean.
- Compare only within the same industry, never across different capital structures.
- Look at three to five years of the company's own ratio, not a single snapshot.
- Check the lease footnotes to see how much of the asset base is rented rather than owned.
- Note the age and depreciation of the fixed assets so a high reading is not just an old, written-down base.
- Cross-read it against the total asset turnover ratio and operating margins for a fuller picture.
A ratio that survives all five checks is a real signal. One that fails any of them is a prompt to dig deeper, not a verdict.
FAQs
What is a good fixed asset turnover ratio? There is no single good number. It depends entirely on the industry and the company's own trend. Capital-intensive sectors like airlines and utilities run low single digits, while asset-light software and service firms run much higher. Judge it against direct competitors and the company's own history.
How is the fixed asset turnover ratio calculated? Divide net sales by average net fixed assets. Take net sales from the income statement and net property, plant, and equipment from two consecutive balance sheets, then average the opening and closing figures for the denominator.
What does a high fixed asset turnover ratio tell investors? It usually signals that the company generates strong revenue from a relatively small fixed asset base. That can reflect genuine efficiency, but it can also come from heavy leasing or an aging, heavily depreciated asset base, so confirm the cause before treating it as a positive.
Related reading
The fixed asset turnover ratio is one input, not a conclusion. Pair it with the total asset turnover ratio, return on assets, and operating margin to see whether efficiency on fixed capital actually reaches the bottom line. From there, work outward into the company's capital spending plans and lease structure, which is where the next layer of meaning sits.
Worth the read?


