
Financial Statement Analysis — Read a Company Like Risk
Financial statement analysis is reading the income statement, balance sheet, and cash flow together to find where a company’s risk actually lives.

Financial statement analysis is the process of reading a company's income statement, balance sheet, and cash flow statement together to judge how it earns, what it owes, and how durable that performance is. It turns raw filings into a view of profitability, liquidity, solvency, and efficiency. Done well, it tells you where the risk lives before you ever take a position.
Most explanations of this subject stop at the mechanics. They define the ratios, walk through a sample calculation, and leave it there. That is useful, but it is also where the real work begins. Numbers on a filing describe the past with confidence; they describe the future only as probability. The point of the analysis is not to admire clean figures. It is to find the places where the figures stop being clean.
What financial statement analysis actually means
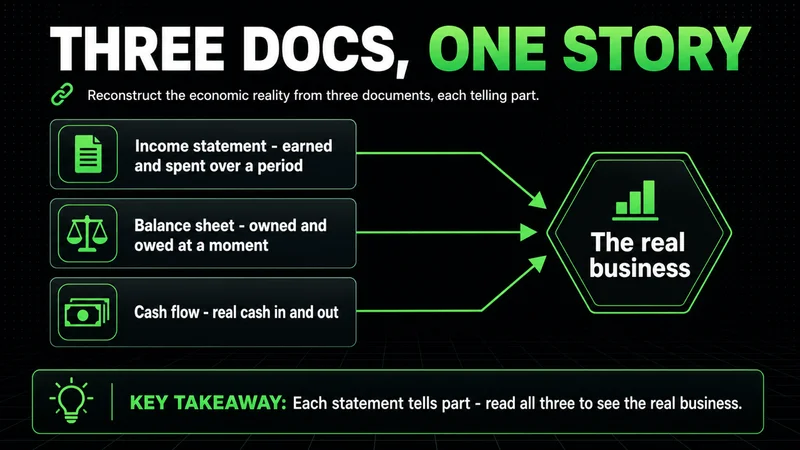
Financial statement analysis meaning comes down to one idea: you are reconstructing the economic reality of a business from three documents that each tell part of the story.
The income statement shows what the company earned and spent over a period. The balance sheet shows what it owns and owes at a single point in time. The cash flow statement shows how cash actually moved, which often disagrees with reported profit. No single statement is enough. Read in isolation, each one can be made to look better than the business is.
The discipline is treating the three as one system. Revenue without cash collection is a claim, not money. Profit funded by rising debt is borrowed time. The analysis exists to keep those distinctions in front of you.
The core components you are working with
Financial statement analysis components fall into three documents and a handful of lenses you apply across them.
- Income statement: revenue, cost of goods sold, operating expenses, and the margins that fall out of them.
- Balance sheet: assets, liabilities, and equity, with the relationship between them defining solvency.
- Cash flow statement: operating, investing, and financing cash flows, which reveal whether profit is real.
- Notes and disclosures: where the assumptions, one-time items, and accounting choices are explained.
The lenses matter as much as the documents. Horizontal analysis tracks a line item across several periods to expose a trend. Vertical analysis reads down a single statement, expressing each item as a percentage of a base, so a small company and a large one become comparable. Ratio analysis ties items across statements together. You rarely use one lens alone.
How to analyze financial statements step by step
How to analyze financial statement analysis step by step is less about a fixed checklist and more about a disciplined order of questions. Work from the broad to the specific.
- Define the objective. A lender, an equity investor, and a supplier read the same filing for different risks. Decide which question you are answering before you open the file.
- Read the cash flow statement first. Cash is harder to manipulate than accrual earnings. If operating cash flow diverges from net income for several periods, start there.
- Run vertical analysis on each statement. Convert the income statement and balance sheet to percentages. Structure jumps out faster than absolute numbers.
- Run horizontal analysis across periods. Three to five years of trend tells you more than any single quarter.
- Compute the ratios that fit your objective. Liquidity and leverage for credit risk; margins and returns for equity quality.
- Read the notes. This is where the surprises hide. Skip them and the analysis is incomplete.
The order is the point. Starting with ratios before context is how analysts get anchored to a clean number and miss the trend underneath it.
The formulas and ratios that carry the most weight
Financial statement analysis formula work organizes into four families. You do not need all of them on every company; you need the ones that match the risk you are evaluating.
- Liquidity: current ratio (current assets / current liabilities) and quick ratio. These answer whether near-term obligations are covered.
- Solvency and leverage: debt-to-equity (total debt / shareholders' equity) and the debt-to-asset ratio. These measure how much of the business is financed by borrowing.
- Profitability: gross margin, operating margin, net margin, and return on equity. These show whether the business earns enough on what it sells and on the capital it employs.
- Efficiency: inventory turnover, receivables turnover, and asset turnover. These reveal how hard the company's assets are working.
A ratio in isolation says almost nothing. A current ratio of 1.5 is reassuring for a software firm and thin for a manufacturer carrying heavy inventory. Context, not the number, is the analysis.
Reading the result, not just the ratio
Financial statement analysis interpretation is where most of the value is created or lost. The calculation is arithmetic. The interpretation is judgment.
Interpretation means asking why a number moved, not just noting that it did. Rising revenue with falling operating cash flow usually means the company is booking sales it has not collected. Improving net margin driven by a one-time asset sale is not improving operations. A debt-to-equity ratio that looks stable while interest coverage deteriorates tells you the cost of that debt is rising faster than the balance can show.
The skill is comparison. Compare a company to its own history, to direct competitors, and to the structure of its own industry. A figure only becomes a signal when it sits against a relevant baseline.
Financial statement analysis vs financial ratio analysis
Financial statement analysis vs financial ratio analysis is a distinction worth getting right, because the two are often used interchangeably and they are not the same thing.
Ratio analysis is a tool inside the larger process. It takes two figures and expresses their relationship. Financial statement analysis is the whole discipline: reading the statements together, applying horizontal and vertical analysis, studying the notes, weighing accounting choices, and forming a judgment about the business. Ratios are one input to that judgment.
Treating ratios as the entire analysis is a common mistake. A pile of ratios with no narrative about the business is data, not understanding. The statements supply the context that makes the ratios mean something.
The red flags that matter most
Financial statement analysis red flags are the patterns that tell you the clean surface is hiding something. These are the conditions that should slow you down.
- Net income rising while operating cash flow falls or turns negative.
- Receivables and inventory growing faster than revenue, period after period.
- Recurring "one-time" charges that appear every single year.
- Revenue recognized aggressively near period-end to hit a target.
- Debt rising while the business explains away weak coverage as temporary.
- Frequent changes in accounting policy, auditor, or reporting segments.
None of these is proof of trouble on its own. Each is a reason to read further, slow down, and demand a better explanation from the notes before you trust the headline figures.
The market does not care about opinions, effort, or conviction. Risk exists whether you acknowledge it or not — and the filings are where it shows up first.
Where the analysis breaks down
This is the part most guides leave out. Financial statement analysis is built on reported, historical, accrual-based data, and every one of those words is a limit.
The analysis works cleanly when accounting choices are consistent and the business model is stable. It breaks down the moment those conditions fail. A company that changes revenue recognition, restructures segments, or grows through acquisition can show ratios that are technically accurate and economically meaningless, because the periods are no longer comparable. Filings are also stale by the time you read them; a quarter-old balance sheet says little about a business whose conditions shifted last week. And accrual accounting gives management real discretion over timing, which is exactly why the cash flow statement deserves the first read.
Most blown analyses do not come from bad math. They come from trusting a comparison that the underlying accounting no longer supports.
Putting it together as a practitioner
I read filings the way I read price: structure first, then context, then risk. Strong numbers in one period are less important than the trend and the story behind them, the same way a strong move matters less than how the market behaves afterward. Financial statement analysis example work for investors is not about finding a company with flawless ratios. It is about understanding where the business is fragile and whether the price already reflects that fragility.
Capital preservation comes first. The job of the analysis is to find the risk before you commit, not to confirm a decision you already made. A company can look excellent on every standard metric and still be one accounting change or one credit cycle away from a different reality. The analysis is reactive, not predictive — it narrows uncertainty, it does not remove it.
Related reading
- Balance sheet analysis — reading assets, liabilities, and equity in depth
- Cash flow analysis — why operating cash flow is the hardest number to fake
- Debt-to-equity ratio — measuring how much of a business runs on borrowed capital
- Company analysis — combining financials with competitive and market context
Worth the read?


