
How to Analyze a Stock — A Practitioner’s Checklist
How to analyze a stock: read three years of statements, price a few ratios against peers, then read the chart for context. A practitioner’s checklist.

To analyze a stock is to decide what a business is worth, then check whether the price agrees with you. You do it by reading the company's financial statements, pricing a few ratios against its history and its peers, and reading the chart for where buyers and sellers have actually committed capital. Everything else is detail layered on top of those two questions: what is this worth, and what is the market currently paying.
Most beginners invert that order. They start with the chart, find a shape they like, and reverse-engineer a story to justify it. That sequence feels productive and produces nothing durable. A stock is a claim on a real business, and the business is what eventually pulls the price. The chart tells you about timing and crowd behavior; it does not tell you whether the company can fund itself next year.
What it means to analyze a stock
Stock analysis is the structured judgment of whether a share is worth owning at its current price. The meaning is narrower than people assume. You are not predicting tomorrow's close. You are estimating a range of fair value from the company's economics, then comparing that range to the quote on the screen.
Two disciplines carry most of the work. Fundamental analysis reads the business: revenue, margins, debt, cash generation, and competitive position. Technical analysis reads the price record: trend, structure, and the levels where supply and demand changed hands. They answer different questions. Treating them as rival camps is one of the more expensive habits a new investor can pick up, because each covers exactly the blind spot of the other.
The basics come down to three inputs you can run on any ticker:
- Read the statements. Confirm the business funds itself and grows its margins over time.
- Price the valuation. Check that what you are paying is reasonable against history and peers.
- Read the chart for context. See where the market has actually committed capital before you commit yours.
The rest of this guide walks each one in order.
How to read the financial statements
Start with the three core statements, because they are the only place the business speaks in numbers it has to defend.
- Income statement. Revenue, gross margin, operating margin, and net income. You want margins that are stable or widening, not eroding under competition.
- Balance sheet. Assets against liabilities, with debt and cash sitting at the center. A company that survives a bad year is usually one that did not need a perfect one.
- Cash flow statement. Operating cash flow tells you whether reported profit is real. Earnings can be shaped by accounting choices; cash is harder to manufacture.
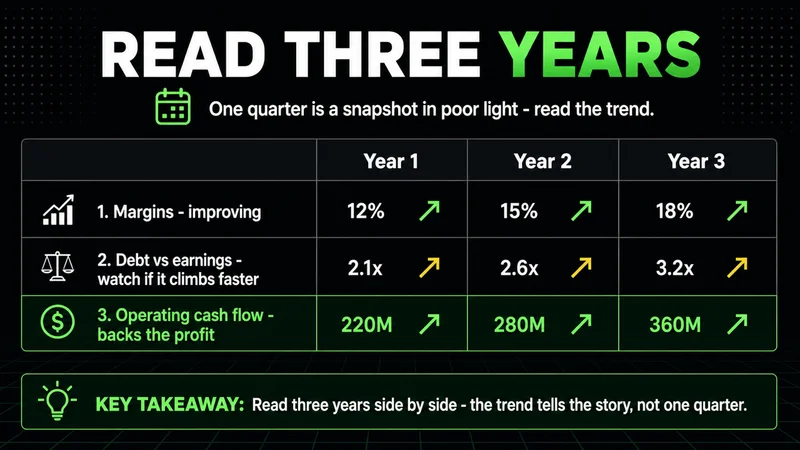
Read three years side by side, not one quarter in isolation. A single quarter is a snapshot in poor light. The trend across years shows whether margins are improving, whether debt is climbing faster than earnings, and whether the cash flow actually backs the profit. When operating cash flow consistently trails net income, treat the gap as a question, not a footnote.
How to price the valuation with ratios
Once the statements check out, the next step is whether the price is reasonable. A good business at a punishing price is still a poor trade. A few ratios carry most of that judgment.
- Price-to-earnings (P/E): price divided by earnings per share. It frames how many years of current earnings the market is paying for. High is not automatically expensive; it has to be justified by growth.
- PEG: the P/E set against the earnings growth rate, which keeps a fast grower from looking overpriced on P/E alone.
- Debt-to-equity: how much of the company is financed by borrowing. A heavy load is survivable in calm conditions and dangerous when rates rise or demand softens.
- Return on equity: how efficiently the company turns shareholder capital into profit.
Ratios mean nothing in isolation. A P/E of 25 is rich for a slow utility and cheap for a company compounding earnings at 30% a year. Always read a ratio three ways: against the company's own history, against its direct competitors, and against the sector. Here is the checklist in motion. A retailer trades at a P/E of 14 while its closest competitor trades at 22, with similar margins and lower debt. That gap is the start of a thesis. It is not the thesis itself. You still have to ask why the discount exists before you decide it is an opportunity rather than a warning.
Fundamental analysis vs technical analysis
This is where most guides force a choice and most new investors pick the wrong fight. The honest framing is that fundamental and technical analysis answer sequential questions, not competing ones.
Fundamental analysis tells you what to own and roughly what it is worth. Technical analysis tells you when the price is offering that value on reasonable terms. A company can be undervalued for two years before the chart confirms that buyers have arrived. Buying purely on the fundamental case, with no read on price structure, often means sitting through a long drawdown that better timing would have avoided.
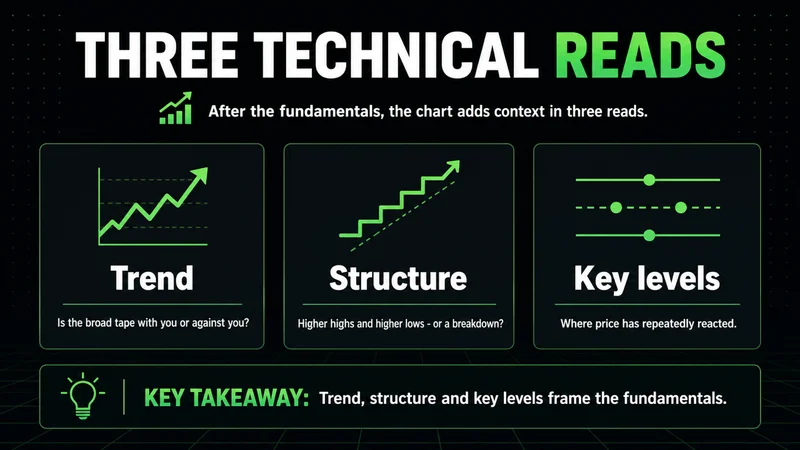
For technical context, three reads do most of the work:
- Trend. Whether the broad tape is on your side or against it.
- Structure. The sequence of higher highs and higher lows, or the breakdown of it, which shows whether buyers still control the move.
- Key levels. The points where price has repeatedly turned, marking where supply and demand actually changed hands rather than where you wish they had.
None of this predicts. It describes where the market has committed capital, and that context is what keeps an entry from being a guess.
Trading without context is gambling with better vocabulary.
That line applies in both directions. A chart pattern with no business behind it is a guess. A valuation with no read on price behavior is a guess wearing a spreadsheet.
A repeatable checklist for analyzing any stock
The value of analysis is that it repeats. A process you can run the same way on any ticker beats a brilliant one-off read you cannot reproduce. Run these steps in order.
- Understand the business. What does the company sell, and who pays for it? If you cannot explain it plainly, stop here.
- Read three years of statements. Margins, debt, and cash flow. Confirm the profit is backed by cash.
- Price the valuation. P/E, PEG, debt-to-equity, and return on equity against history, peers, and sector.
- Check the competitive position. Is there a durable advantage, a moat, that protects those margins from being competed away?
- Read the chart for context. Trend, structure, and the key levels. Decide whether the price is offering value on reasonable terms.
- Define your invalidation before you buy. Name the level or the fact that would prove the thesis wrong, and size the position so being wrong is survivable.
The last step is the one beginners skip and professionals never do. Analysis without a defined point of being wrong is just an opinion with extra steps.
Where stock analysis breaks down
Every framework has conditions under which it inverts, and a checklist is no exception. Fundamental analysis reads cleanly when a business is stable and the cycle is mid-stream. It misleads badly at cyclical peaks, where a stock looks cheapest exactly when earnings are about to roll over. A miner or homebuilder showing a P/E of six near the top of its cycle is not a bargain; it is a warning that the market is already pricing the decline the trailing numbers have not caught yet.
Technical structure has its own failure point. It describes participant behavior in normal liquidity, and during a macro shock or a forced-selling event, the levels that held for months mean almost nothing. Price gaps through them because the people defending those levels are no longer the ones setting the price. The framework does not break because it is wrong. It breaks because the regime it was built to describe has changed underneath it.
This is the gap most guides leave open. They present analysis as a clean procedure that always resolves to an answer. In live conditions it resolves to a probability, and the probability degrades the moment the regime shifts. Knowing where your own method stops working is more valuable than any single ratio.
Common mistakes and risks beginners face
Most early losses are not analytical failures. They are discipline failures wearing the costume of analysis.
- Confirmation hunting. Building the thesis first, then searching for data that supports it. The fix is to actively look for the strongest case against the position.
- Anchoring on one metric. A low P/E is not a reason to buy. It is one input among several, and on its own it is often a trap.
- Ignoring the cash flow. Reported earnings can be managed. When cash flow does not track profit, the difference is where the risk lives.
- No defined risk. Buying with no level or fact that would prove the idea wrong. Without it, a losing position becomes a story you keep telling yourself.
The thread through all four is the same. Better analysis does not survive worse process. A reasonable read on a stock, sized correctly and held with a clear invalidation, outlasts a brilliant read sized on conviction and held on hope.
FAQs
What does it mean to analyze a stock? It means estimating what a business is worth from its financials and competitive position, then comparing that estimate to the current market price. The goal is to judge whether the price is reasonable for what you are buying, not to predict the next move.
Is fundamental or technical analysis better for beginners? Neither alone. Fundamental analysis tells you what to own and roughly what it is worth; technical analysis tells you when the price is offering that value on reasonable terms. Beginners are usually better served learning to read financial statements first, since that is what ultimately pulls the price.
What is the most important number when analyzing a stock? There is no single one, but cash flow is the hardest to fake. If reported earnings are not backed by operating cash flow over several years, treat every other ratio with suspicion until you understand why.
The short version
Analyzing a stock comes down to two questions asked in order. What is the business worth, read from three years of statements and a few ratios against history and peers? And what is the market currently paying, read from the trend, structure, and key levels on the chart? Fundamental analysis answers the first; technical analysis sharpens the timing on the second.
Run the same six-step checklist every time, define where you are wrong before you commit capital, and stay aware that both methods degrade when the regime shifts. The process is what compounds. A repeatable, risk-defined read on any ticker will outperform a flash of insight you cannot reproduce, every quarter, over a long enough record.
Worth the read?


