
Money Flow Index — How to Read It Without Guessing
The money flow index is a volume-weighted momentum oscillator. Here is how to read it against structure, confirm it, and know when it stops working.
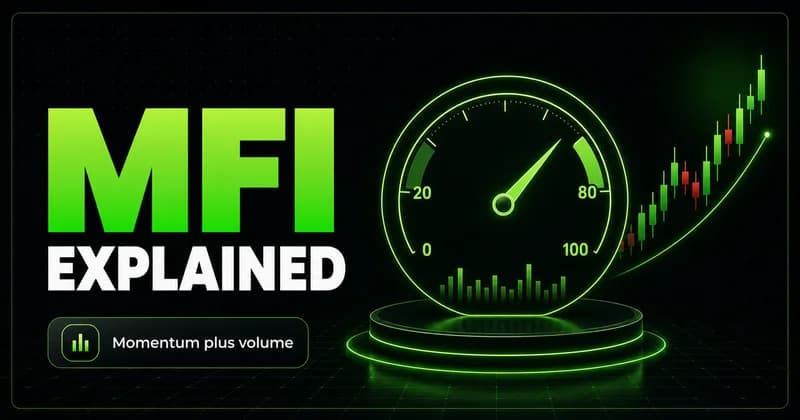
The money flow index is a volume-weighted momentum oscillator that measures how much capital is pushing into and out of a security across a set lookback, scaled from 0 to 100. It answers one question: is the recent move backed by participation, or is price drifting on thin volume. That distinction is the whole reason the indicator exists, and it is also where most traders misread it.
The money flow index is often described as a volume-aware version of the relative strength index. That comparison is useful, but it can make the tool sound more decisive than it is. A number on a chart does not tell you what to do. It tells you what conditions are present, and conditions only matter when you read them against structure.
What the money flow index meaning actually is
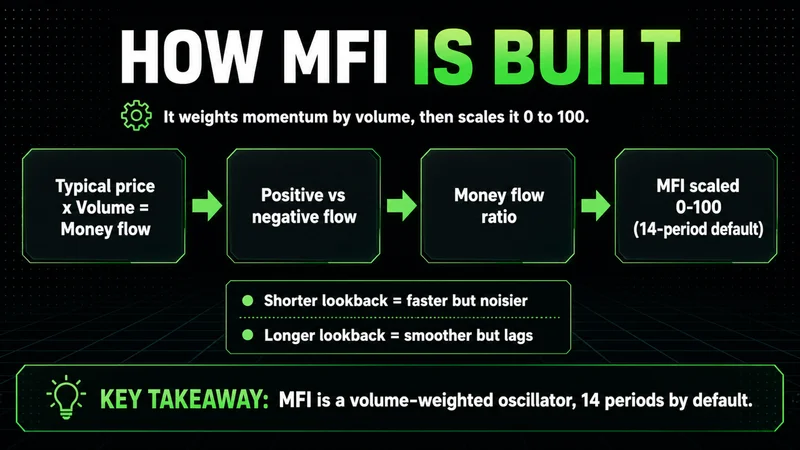
The money flow index meaning comes down to pressure, not prediction. Each bar gets a typical price, the average of its high, low, and close. That typical price is multiplied by volume to produce raw money flow. When the typical price rises versus the prior bar, that flow counts as positive. When it falls, the flow counts as negative. Over the lookback, the indicator compares positive flow to negative flow and converts the ratio into a single reading between 0 and 100.
The practical takeaway is simple. A high reading means buying pressure has carried recent bars. A low reading means selling pressure has. The centerline near 50 is the rough divide between net inflow and net outflow. None of this is a signal on its own. It is context.
How the money flow index indicator is built
The default lookback is 14 periods, the same convention the relative strength index uses. Shorter settings react faster and produce more noise. Longer settings smooth the line and lag the turn. The 14-period default is a reasonable starting point, not a rule.
The construction matters because of one detail traders skip. The money flow index indicator needs reliable volume to mean anything. On centralized futures like NQ or ES, exchange volume is clean and the reading is trustworthy. On instruments where reported volume is fragmented or estimated, the same line is built on weaker data. The math does not change. The quality of the input does.
Reading the money flow index chart pattern
The most common money flow index chart pattern is the move into an extreme and back. Above 80 is treated as overbought. Below 20 is treated as oversold. Those thresholds describe stretched conditions, not reversals. Stretched can stay stretched.
The reading worth more attention is the relationship between the line and price. When price makes a new high but the money flow index makes a lower high, participation is fading even as price extends. That divergence is the indicator doing its actual job: showing that the move is running on less fuel than it appears. The reverse holds at lows, where price prints a lower low while the indicator turns up.
Divergence is not a trigger. It is a warning that the current leg may be losing support. The trigger, if there is one, comes from price.
What a money flow index trading signal looks like in practice
A money flow index trading signal is strongest when it lines up with a level that already matters. A reading below 20 into a prior area of acceptance, followed by the line reclaiming 20 and holding, is the cleaner version of an oversold setup. Robert Williams, who developed the indicator, framed this reclaim as a failure swing: the line dips to an extreme, recovers, pulls back without returning to the extreme, and then breaks its prior pivot. That sequence filters out a large share of the readings that look interesting and lead nowhere.
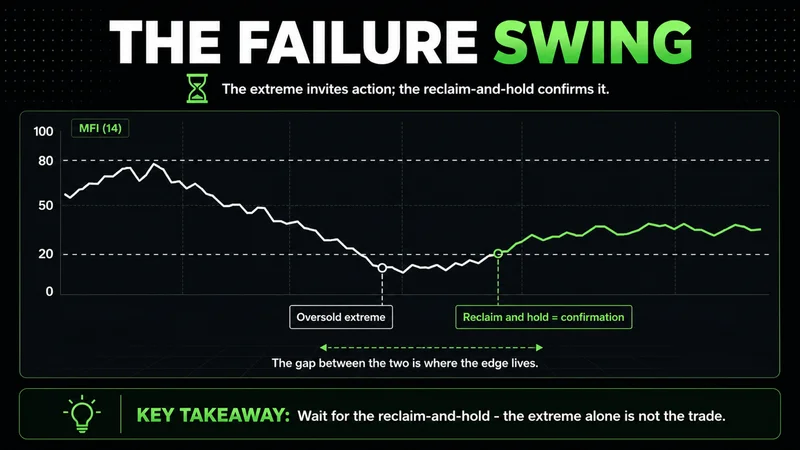
The point of the failure swing is patience. An extreme reading invites action. The reclaim and hold demand confirmation first. That gap between the two is where most of the edge lives.
Money flow index vs relative strength index
The money flow index vs relative strength index question comes up constantly, and the honest answer is that they are close relatives doing slightly different jobs. Both are bounded oscillators using a 14-period default. Both flag overbought and oversold zones. The difference is volume.
The relative strength index reads price change alone. The money flow index weights that change by how much volume backed it. In conditions where volume is informative, that weighting can surface fading participation a step earlier than price-only momentum does. In conditions where volume is thin or unreliable, the volume weighting adds noise rather than signal. Neither is universally better. The instrument and the data decide which one is telling you more.
How to confirm the money flow index before acting
Money flow index confirmation is the part that separates a tool from a decision. The reading sets a condition. Confirmation comes from price doing something at a level you already respected before the indicator lit up.
A workable sequence looks like this:
Mark the structural level first, independent of the oscillator. A swing high, a swing low, a prior area of acceptance.
Note the money flow index condition as it interacts with that level, overbought or oversold, diverging or aligned.
Wait for price to reject or reclaim the level rather than acting on the reading alone.
Define invalidation at the point where the structural read is simply wrong, then size so that being wrong is an operational cost, not an emotional one.
The indicator never enters the trade. Structure and execution do. Indicators are tools, not decision-makers, and trading the reading without context is gambling with a better vocabulary.
When the money flow index stops working
Every oscillator has a regime where it inverts, and the money flow index is no exception. In a strong, one-directional trend, the line can sit pinned above 80 or below 20 for an extended stretch while price keeps going. Treating that persistent extreme as a reversal signal is how mean-reversion logic quietly drains an account during the exact move you wanted to be part of.
Gold shows this clearly. GC can respect oscillator structure for hours, then a macro headline expands volatility and the orderly readings stop mapping to anything. The money flow index does not break in trends; the assumption that an extreme must snap back is what breaks. When the broader context is a strong directional move, the divergence and overbought reads lose their meaning, and the only honest play is to step aside or trade with the trend, not against the indicator.
Common money flow index mistakes
The recurring money flow index mistakes are not technical. They are about treating a condition as a command. Acting on an 80 or 20 print with no structural context. Fading a strong trend because the line looks stretched. Shortening the lookback until the indicator fires constantly, then calling the noise opportunity. Forgetting that on thin-volume instruments the entire calculation rests on shaky data.
Most of these come from wanting the indicator to remove uncertainty. It cannot. It narrows the field of conditions worth watching, and that is all a good tool should claim to do.
A money flow index checklist before you act
Before any money flow index trading signal becomes a position, the money flow index checklist is short and structural.
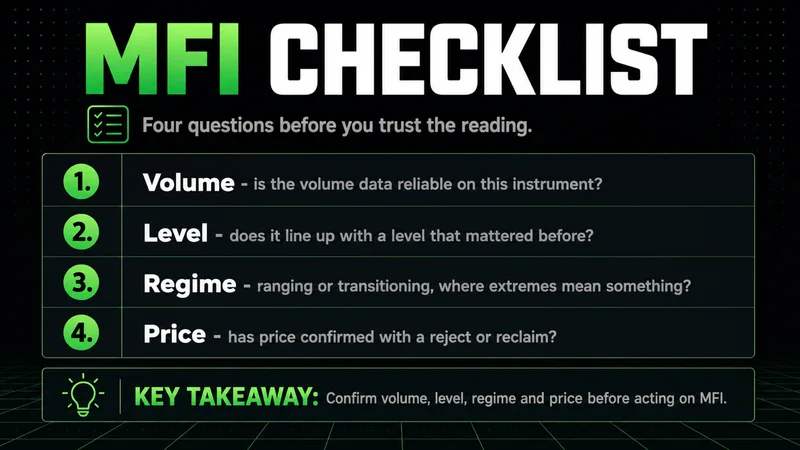
Is the volume data on this instrument reliable enough to trust the reading?
Does the reading line up with a level that mattered before the indicator did?
Is this a ranging or transitioning market where extremes mean something, or a strong trend where they do not?
Has price confirmed with a reject or a reclaim, or am I acting on the oscillator alone?
Is invalidation defined, and is the size small enough that being wrong costs nothing emotional?
If those answers hold, the setup is worth executing. If they do not, the reading was information, not an invitation.
The money flow index earns its place by measuring participation behind a move. Read against structure, with reliable volume and defined risk, it sharpens timing and exposes weak trends before price confirms them. Read in isolation, it becomes one more line promising certainty the market never offers. The indicator is only as disciplined as the process around it.
Worth the read?


