
Moving Average Pullback Trading Setups Explained
Moving average pullback trading uses trend, structure, candle-close confirmation, and defined invalidation to assess retests and retracements.
Moving average pullback trading uses a rising or falling average to frame trend direction, then waits for price to retrace before considering an entry. The average is context, not a signal by itself. Structure, a confirmed close, and defined invalidation decide whether the setup is usable.
A touch of an average, Fibonacci level, or former resistance only identifies where a reaction could matter. Price must still show acceptance or rejection before risk becomes clear.
Moving average pullback trading starts with trend context
A moving average has two useful features: its slope and price's position relative to it. Price above a rising long-term average supports a bullish bias. Price below a falling long-term average supports a bearish bias. Either condition loses value when the average is flat and price repeatedly crosses it.
In an uptrend, a rising average can act as dynamic support during a pullback. In a downtrend, a falling average can act as dynamic resistance during a rally. The word “dynamic” matters because the reference changes with each candle. It is not a fixed price level.
A practical trend filter combines three observations: the average is clearly sloped, price is holding on the trend side of it, and swing structure agrees. For an uptrend, that means higher highs and higher lows remain intact. For a downtrend, lower highs and lower lows should remain intact. Agreement among those conditions is more useful than the average alone.
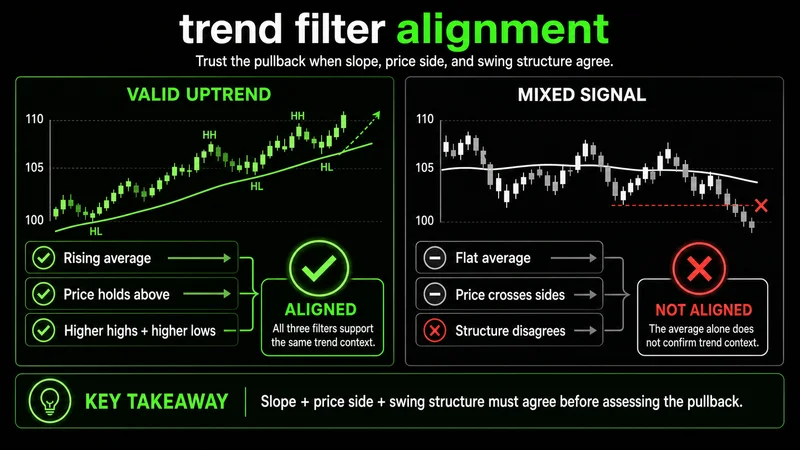 Moving-average direction becomes useful when price position and swing structure agree.
A short-term average crossing a long-term average can warn that momentum is changing, but it does not guarantee a reversal. Use the crossover to organize context, then let current price behavior confirm or reject the idea.
A pullback is a test, not an automatic reversal
A pullback is a temporary move against the prevailing trend. In an uptrend, price retreats from a recent high while the larger bullish structure remains intact. In a downtrend, price rallies from a recent low without breaking the broader bearish sequence.
That distinction separates a pullback from a reversal. A pullback preserves the structure supporting the trend. A reversal breaks that structure and begins accepting price beyond the level that should have held. One candle through a reference is not always enough. The close and the behavior that follows carry more information than an intrabar touch.
The cleanest pullbacks often return to an area where several forms of context overlap. A rising average may meet former resistance that has become support. A Fibonacci retracement zone may sit in the same region. None of these tools creates demand. Their overlap simply identifies an area where confirmation may provide a risk-defined decision.
Three pullback methods organize the same decision
The breakout-retest method starts with a fixed level. Price clears resistance, pulls back, and tests whether that old resistance can hold as new support. A valid bullish retest requires rejection, a reclaim, or a bullish candle close. If price accepts below the level, the original breakout has failed its test.
The Fibonacci method measures the prior trend swing from low to high in an uptrend. The 23.6%, 38.2%, 50%, and 61.8% retracement levels mark possible reaction zones. They are reference points, not promises. The 38.2% through 61.8% area can focus attention, but price must still reject the zone or reclaim support.
The moving-average method uses a rising average as dynamic support. Price pulls back toward the line, stabilizes, and closes back in the trend direction. The setup remains valid only while price respects the average and the related swing low. A falling average applies the same logic in reverse during a bearish rally.
These methods differ in what they measure: a retest uses horizontal structure, Fibonacci measures the depth of a prior swing, and a moving average tracks a changing reference. Their decision process is the same: establish the trend, locate the test area, wait for confirmation, and define the point that proves the idea wrong.
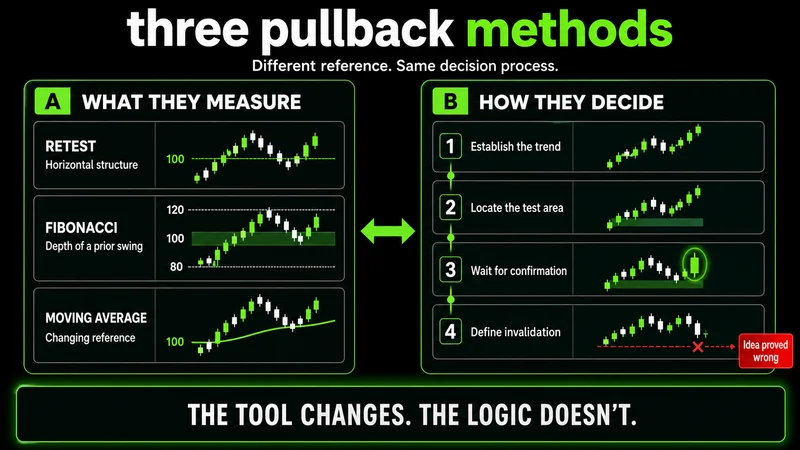 Three pullback methods use different references but require the same confirmation process.
Confirmation should come from a completed candle
An intrabar touch can look convincing before the candle closes. Price may briefly reclaim an average or support level, then finish below it. Waiting for the close reduces that ambiguity. It also prevents an entry from being based on a reaction that never held.
Useful bullish confirmation can take several forms:
- A candle rejects the pullback zone and closes back above support.
- Price trades below a reference briefly, reclaims it, and holds the close.
- A bullish candle forms after the pullback while the higher-low structure remains intact.
- Momentum resumes without price closing through the defined invalidation level.
Bearish confirmation reverses those conditions. Price rallies into resistance, rejects the area, and closes back below it while the lower-high structure remains intact.
A concrete example connects entry, target, and risk
Assume an illustrative market breaks above resistance at 100, advances to 104, and then pulls back. The long-term moving average is rising near 100, and the former resistance line is in the same area. Price briefly trades below 100 but closes back above it with the prior higher low still intact.
The close supplies confirmation. A trader could use the next candle as an entry trigger, place invalidation below the retest low and support zone, and treat the prior high near 104 as the first target area. The exact execution depends on the distance between entry and invalidation. If that distance requires excessive risk, the setup is structurally valid but operationally unusable.
Now change one detail. Price closes below 100, fails to reclaim the rising average, and breaks the prior higher low. The pullback thesis is no longer intact. Holding the position because the average might recover replaces defined risk with hope.
Invalidation belongs to the setup before entry
Invalidation is the price behavior that proves the trade premise wrong. It should be identified before entry, not chosen after the market moves against the position. For a breakout retest, invalidation normally sits below the support zone or retest low. For a Fibonacci pullback, it sits below the relevant retracement zone and supporting structure. For a moving-average pullback, it sits beyond the average and the swing that must hold.
Use the following decision sequence before acting:
- Confirm that the broader trend and swing structure agree.
- Mark the pullback area before price reaches it.
- Wait for a completed candle to confirm rejection or reclamation.
- Identify the structural level that invalidates the setup.
- Compare the entry-to-invalidation distance with the available target.
- Skip the trade if the risk cannot be controlled.
The average itself is rarely the entire invalidation. Price can cross a moving line briefly without changing the trend. A close through the average becomes more meaningful when it is paired with acceptance beyond the line or a break of the supporting swing.
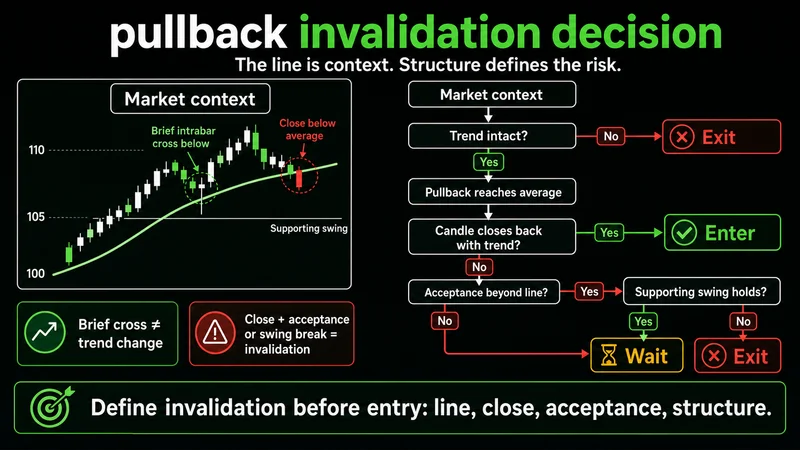 A valid pullback requires trend agreement, candle confirmation, controlled risk, and structural invalidation.
Common mistakes weaken otherwise valid setups
The first mistake is entering on contact. A price touch only says the market reached the area. It does not show that buyers or sellers defended it.
The second is forcing a trend label onto a flat average. When price moves above and below the line repeatedly, the average is describing balance rather than direction. Pullback logic becomes unreliable because there is no clean trend to resume.
The third is drawing Fibonacci across an arbitrary move. The tool should measure a clear swing low to swing high in an uptrend, or the reverse in a downtrend. Poor anchors produce precise-looking levels with weak structural meaning.
The fourth is placing a stop at the closest convenient price instead of beyond structural invalidation. A stop inside normal pullback noise can be triggered while the premise remains intact. If a structural stop makes the risk unacceptable, reduce exposure or skip the trade.
The fifth is assuming a crossover guarantees a new trend. A short-term average moving above or below a long-term average can signal momentum, but current structure still decides whether the signal deserves attention.
When moving-average pullbacks do not work
This framework performs poorly in sideways, low-quality conditions. A flat average, overlapping candles, and repeated closes on both sides of the line show that neither direction has sustained control. What appears to be dynamic support or resistance is often just the center of a range.
It also weakens during sharp volatility expansion. Price can move through an average, Fibonacci zone, and prior level before a normal candle close provides useful confirmation. In that environment, the distance to structural invalidation may become too large for disciplined execution.
Late-stage trends create another problem. Price may still sit above a rising average while the swing sequence is losing momentum. If the next pullback breaks the prior higher low, the average can remain pointed upward even though the trade premise has already failed. Structure leads the decision; the average follows it.
Apply the setup as a repeatable process
Start with the trend. Mark swing structure, the long-term average, broken support or resistance, and the relevant Fibonacci zone. Wait for price to enter the area, require a completed-candle response, and define invalidation beyond the structure that must hold. The prior high, prior low, or next resistance or support provides a logical target area.
A pullback setup is not valuable because several lines meet on a chart. It is valuable when those references produce a clear test, current price confirms the test, and the invalidation level keeps the decision controlled. If any part is missing, patience is the higher-quality execution.
Worth the read?


