
Net Profit Margin — What the Number Actually Tells You
Net profit margin is the share of revenue a company keeps as profit after all costs. Here is the formula, how to read it, and when the number misleads.

Net profit margin is the share of revenue a company keeps as profit after every expense, interest payment, and tax is settled. It answers one question: of each dollar of sales, how many cents survive to the bottom line. A 12% net profit margin means 12 cents of every revenue dollar becomes net income. The number is simple. Reading it correctly is not, and most beginners stop at the calculation when the interpretation is where the work lives.
The margin is a ratio of two figures pulled straight from the income statement: net income on top, total revenue on the bottom. Both numbers are reported, so anyone can compute it in seconds. What separates a useful read from a misleading one is context — the industry, the trend, and the quality of the earnings sitting inside that net income line.
What net profit margin means in plain terms
Net profit margin measures profitability after all costs. Gross margin strips out only the cost of goods sold. Operating margin goes further and removes operating expenses. Net profit margin removes everything that is left: interest, taxes, one-time charges, and any other line that touches the income statement before net income.
Because it sits at the end of the statement, the net profit margin meaning is broader than the other two. It reflects pricing power, cost control, capital structure, and the tax position all at once. That breadth is its strength and its weakness. A single number compresses a lot of moving parts, and parts that move for unrelated reasons can push the margin the same direction.
The net profit margin formula
The net profit margin formula is straightforward.
Net Profit Margin = (Net Income / Total Revenue) × 100
Net income is the final profit figure after cost of goods sold, operating expenses, interest, and taxes. Total revenue is the top line, before any deductions. Multiply by 100 to express the result as a percentage. Both inputs come from the same income statement covering the same period, which matters more than it sounds — mixing a trailing-twelve-month net income with a single-quarter revenue figure produces a number that means nothing.
How to calculate net profit margin with an example
The net profit margin calculation takes three steps. First, find net income on the income statement. Second, find total revenue. Third, divide the first by the second and multiply by 100.
Work a net profit margin example. A company reports 5,000,000 in revenue for the year. After cost of goods sold, operating expenses, interest, and taxes, net income comes to 600,000. The margin is 600,000 divided by 5,000,000, which is 0.12, or 12%. For every dollar of sales, the company keeps 12 cents.
The steps stay the same regardless of company size:
Pull net income from the bottom of the income statement.
Pull total revenue from the top.
Divide net income by revenue, then multiply by 100 to get the percentage.
That is the entire mechanic. The discipline is making sure both figures cover the same window and that the net income line has not been distorted by something that will not repeat.
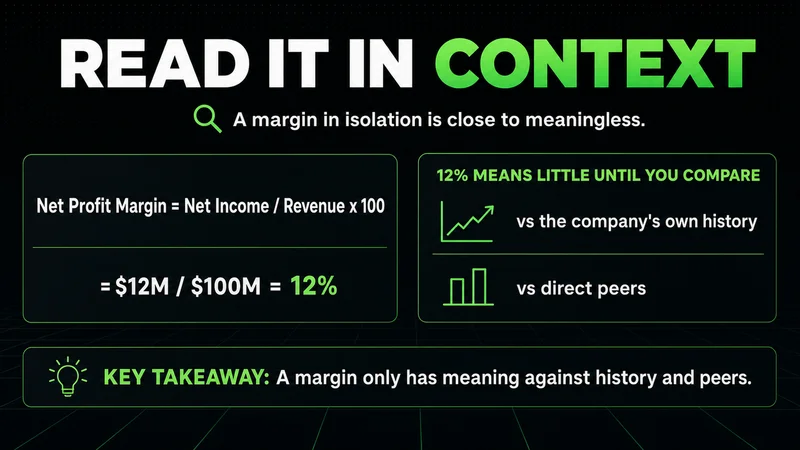
Net profit margin interpretation depends on context
A margin in isolation is close to meaningless. Net profit margin interpretation starts with two comparisons: the company against its own history, and the company against its direct peers. A 12% margin tells you little until you know whether last year was 9% or 15%, and whether competitors run at 8% or 18%.
The trend usually carries more signal than the level. A margin climbing steadily over several years suggests improving pricing power or cost control. A margin sliding while revenue grows suggests the company is buying that growth with discounts or rising expenses. The direction of travel is the part an investor can act on.
What is a good net profit margin
There is no universal good number, because the figure is bound to the business model. A grocery chain running a 2% net profit margin can be healthy, since the model is built on volume and inventory turnover, not markup. A software company at 2% would be a problem, because the model assumes high margins on low marginal cost. The same percentage reads as strength in one industry and weakness in another.
Use the net profit margin benchmark that fits the sector. Compare a retailer to retailers, a bank to banks, an industrial to industrials. A margin that beats the industry median and holds or rises over time is the practical definition of good. A margin that looks high in absolute terms but trails every direct competitor is not.
Net profit margin vs gross profit margin
The net profit margin vs gross profit margin comparison is the one beginners confuse most. Gross profit margin measures revenue minus cost of goods sold, divided by revenue. It isolates how profitably a company produces or sources what it sells. Net profit margin measures what survives after everything — operating costs, interest, taxes, and one-time items.
Reading them together is more useful than reading either alone. A wide gap between a strong gross margin and a thin net margin points to heavy operating, interest, or tax costs eating the difference. A company with healthy gross margin and collapsing net margin is usually carrying a cost structure or a debt load that the product economics alone would not predict. The gross number tells you about the product; the net number tells you about the whole business.
How investors use net profit margin to read earnings quality
This is where the top results tend to stop, and where the real work begins. Net income — the numerator — is the most adjusted figure on the income statement. It absorbs one-time gains, asset write-downs, litigation charges, and shifts in the effective tax rate. Any of those can move the net profit margin in a single period without changing how the business actually operates.
An investor reading the margin looks past the headline number to what produced it. A margin that jumped because of a one-time asset sale is not the same as a margin that rose because the company cut recurring costs. The first will reverse next period; the second may persist. Share buybacks complicate the comparison further, since they lift per-share figures without touching the margin itself, so margin and earnings-per-share trends can diverge and still both be honest.
The practical move is to read several years of margins side by side, strip out the items management itself flags as non-recurring, and ask whether the remaining trend is stable. A margin that holds steady on clean, recurring earnings is worth more than a higher margin propped up by something that happened once.
Net profit margin limitations and when the number misleads
Every ratio has conditions under which it breaks, and net profit margin limitations are easy to underestimate. The metric reads cleanly in a stable, mature business with recurring revenue and a steady tax position. It reads poorly in three common situations.
First, early-stage or heavily reinvesting companies often post thin or negative net margins by design, plowing revenue back into growth — the low margin reflects strategy, not weakness. Second, capital-intensive businesses with large non-cash charges like depreciation can show a depressed net margin while generating strong cash flow, so the margin understates the real economics. Third, a single period distorted by a one-time item — a tax settlement, an impairment, a legal charge — produces a margin that looks meaningful but describes an event, not the operation.
The number reads cleanest over multiple periods on a mature business with recurring earnings; outside those conditions, the same calculation can point the wrong way entirely. Pair the margin with the cash flow statement and a multi-year trend before drawing a conclusion. Treating one period's net profit margin as a verdict on the business is the most common mistake beginners make, and it is the one that costs the most.
Use this as a short net profit margin checklist for stock analysis before you trust the figure:
Confirm net income and revenue cover the same period.
Read at least three years of margins, not one.
Strip out items management flags as non-recurring.
Compare against direct industry peers, not a global average.
Cross-check the margin against cash flow from operations.
FAQs
What is net profit margin in simple terms? It is the percentage of revenue a company keeps as profit after every expense, interest payment, and tax. A 12% margin means the company keeps 12 cents of profit from each dollar of sales.
How do you calculate net profit margin? Divide net income by total revenue and multiply by 100. Both figures come from the same income statement covering the same period. If revenue is 5,000,000 and net income is 600,000, the margin is 12%.
What is a good net profit margin? There is no single good number. A 2% margin can be healthy for a high-volume grocer and weak for a software company. Compare the figure against direct industry peers and the company's own trend rather than a universal benchmark.
What is the difference between net profit margin and gross profit margin? Gross profit margin measures revenue minus only the cost of goods sold. Net profit margin measures what remains after every cost, including operating expenses, interest, and taxes. Reading them together shows how much of the product's profitability survives the rest of the business.
What does net profit margin tell investors? It signals how efficiently a company converts sales into profit and, read over several years, whether that efficiency is improving or eroding. The trend and the quality of the earnings behind it matter more than any single period's number.
Worth the read?


