Profit Factor in Trading — What the Number Means
Profit factor is gross profit divided by gross loss. Learn the formula, a worked example, what a good profit factor is, and where it misleads you.
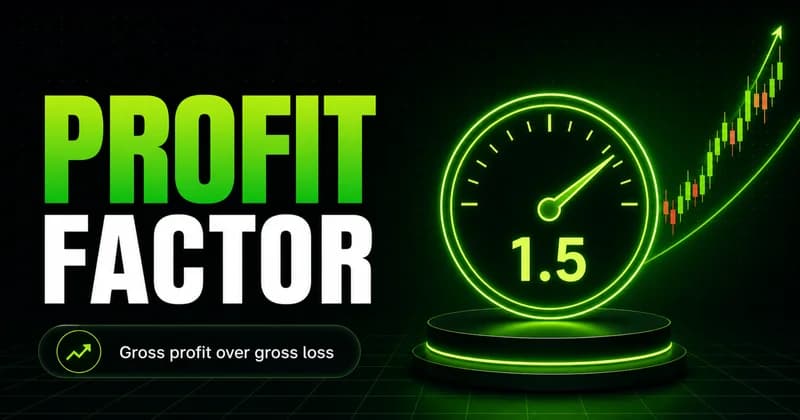
Profit factor is the ratio of gross profit to gross loss across a set of trades, and it answers one question: for every dollar your strategy loses, how many dollars does it make back? A profit factor of 1.0 means you break even before costs. Above 1.0, the system makes money. Below it, the system bleeds. That is the whole definition, and most traders stop reading there. The number that matters is not the ratio itself. It is the trade count behind it.
I have watched accounts post a profit factor near 3.0 over a handful of trades and then give all of it back inside two weeks. The metric was not wrong. It was just measuring noise. Profit factor only becomes a risk-management tool when you understand both how it is built and where it quietly misleads you.
What is profit factor in trading?
Profit factor is a single number that compares everything a strategy made against everything it lost. You add up every winning trade to get gross profit. You add up every losing trade to get gross loss. You divide the first by the second. A profit factor of 2.0 means the strategy earned two dollars for every dollar it gave back.
It is a performance metric, not a setup signal. It does not tell you when to enter or where to place a stop. It tells you, after the fact, whether the process you ran produced more reward than risk. That distinction matters, because traders treat it like a grade and then stop interrogating the process underneath it.
The reason profit factor earns attention is that it folds win rate and average trade size into one figure. A strategy can win 40 percent of the time and still post a strong profit factor if the winners are large enough. Another can win 70 percent of the time and sit barely above 1.0 because the losers are bigger than the wins. The ratio exposes that trade-off in a way raw win rate never can.
The profit factor formula and how to calculate it
The profit factor formula is straightforward:
Profit factor = gross profit / gross loss
Gross profit is the sum of all winning trades. Gross loss is the sum of all losing trades, taken as a positive number. Walk through a concrete example.
Say you take 20 trades. Eight of them win, for a combined gross profit of 4,000 dollars. Twelve of them lose, for a combined gross loss of 2,000 dollars. The calculation is 4,000 divided by 2,000, which gives a profit factor of 2.0. The strategy returned two dollars for every dollar it risked and lost, even though it lost more often than it won.
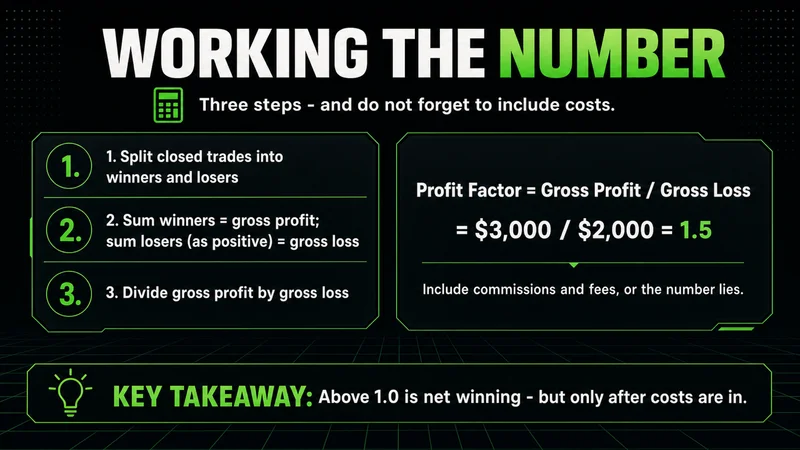
To calculate profit factor on your own record, three steps are enough:
- Separate every closed trade into winners and losers.
- Sum the winners for gross profit; sum the losers, as a positive value, for gross loss.
- Divide gross profit by gross loss.
One detail traders skip: include costs. Commissions, spreads, and slippage belong in the loss column. A backtested profit factor calculated on raw price fills will always read higher than the one you actually live through, often by a meaningful margin.
What counts as a good profit factor
A good profit factor depends on style, market, and trade frequency, but the rough benchmarks are consistent across most credible sources.
| Profit factor | What it usually means |
|---|---|
| Below 1.0 | The strategy loses money; gross losses exceed gross profits |
| 1.0 to 1.3 | Marginal; the edge is thin and costs can erase it |
| 1.3 to 1.6 | Workable for most discretionary and intraday traders |
| 1.6 to 2.0 | Strong; a durable edge with a real safety margin |
| Above 3.0 | Often a warning sign of overfitting or too few trades |
Most professional traders are comfortable in the 1.5 to 1.75 range because it leaves room for live execution to underperform the backtest. Live trading commonly runs 10 to 20 percent below a clean backtest once slippage and emotion enter the picture. A backtested 1.8 can land near 1.5 in practice, and that is normal rather than alarming.
A profit factor that looks too good deserves more suspicion than one that looks modest. A ratio above 3.0 on a short sample usually means the curve was fit to the past, not built for the future.
Profit factor vs expectancy and win rate
Profit factor is one lens, not the whole picture. It pairs best when read against expectancy and win rate, because each measures something the others hide.
| Metric | What it measures | Blind spot |
|---|---|---|
| Profit factor | Total reward relative to total risk | Says nothing about consistency or sequence |
| Expectancy | Average dollar result per trade | Needs a defined risk unit to be comparable |
| Win rate | How often trades close green | Ignores the size of wins and losses entirely |
Win rate on its own is the weakest of the three. A trader can win often and still lose money. Expectancy and profit factor both account for size, which is why they survive scrutiny that win rate does not. Profit factor answers "is the edge worth the risk," while expectancy answers "how much should I expect per trade." Read together, they describe a strategy honestly.
Where profit factor lies to you
This is the section the typical explainer skips, and it is the one that protects your account.
Profit factor is only meaningful across a sample large enough to be stable. On 15 or 20 trades, a single outlier winner can drag the ratio up to a level the process cannot repeat. Strip that one trade out and the number collapses. A high profit factor on a small sample is not an edge. It is a story you are telling yourself with too little data.
The sequence matters as much as the ratio. Two strategies can share an identical profit factor of 1.8 while one drifts smoothly upward and the other swings through a 30 percent drawdown to get there. The ratio cannot see the path. It only sees the endpoints. A trader who cannot survive the path emotionally will abandon a perfectly good strategy at its worst moment, regardless of what the final number says.
There is also a regime problem. Profit factor measured during a calm, trending stretch tells you almost nothing about how the same approach behaves when volatility expands. A momentum strategy can post a clean 2.0 for months and then invalidate the entire figure inside a few violent sessions. The metric reads cleanly right up until the conditions that built it disappear. That is the moment it stops being a measurement and becomes a memory.
A number that summarizes a thousand decisions can only ever be as honest as the worst stretch it was forced to survive.
So treat profit factor as a diagnostic, not a verdict. Ask how many trades produced it, over what conditions, and whether one or two results are doing all the work.
Common profit factor mistakes beginners make
The same handful of errors show up again and again when newer traders lean on this number.
- Judging it on too few trades. A ratio built on 20 results is noise. Most strategies need a few hundred closed trades before profit factor stabilizes.
- Ignoring costs. Leaving out commissions, spreads, and slippage inflates the number and hides a thin or negative edge.
- Chasing a high ratio. Optimizing a backtest until profit factor reads 3.0 or higher usually produces a curve fit to the past, not a process that survives forward.
- Treating it as a standalone grade. Profit factor without drawdown, expectancy, and sample size attached is a half-finished picture.
- Mixing market regimes. Blending calm and volatile periods into one figure averages away the exact risk you most need to see.
Each of these has the same root: trusting one summary number more than the process that generated it. Profit factor reports the result. It does not protect you from the conditions that change it.
How to improve your profit factor over time
Improving profit factor is rarely about finding new entries. It is about adjusting the two inputs, gross profit and gross loss, through better risk management rather than more activity. Three levers do most of the work:
- Shrink the worst losers through tighter, more disciplined invalidation.
- Let strong trades reach their structural target instead of closing early out of discomfort.
- Trade less in low-quality conditions so weak entries stop dragging the sample toward 1.0.
The loss side tends to move the number fastest. Shrinking the denominator does not touch your win rate, so a trader who stops letting a few outsized losses through often gains more than one who hunts for additional winning setups. The profit side is slower and lives in trade management: neither holding a winner nor cutting a loser is dramatic on any single trade, but across a few hundred trades both compound.
Frequency is the quiet variable. Forcing trades during low-quality conditions adds marginal results that drag the ratio toward 1.0. Trading less, but only in high-probability environments, tends to raise profit factor precisely because it removes the weakest entries from the sample. The market rewards patience here more than effort.
FAQs
What is profit factor in trading? It is the ratio of gross profit to gross loss across a set of trades. A profit factor above 1.0 means the strategy makes more than it loses; below 1.0 means it loses money. It folds win rate and trade size into a single figure.
How do you calculate profit factor? Sum all winning trades to get gross profit, sum all losing trades as a positive number to get gross loss, then divide gross profit by gross loss. Include commissions, spreads, and slippage in the loss column so the figure reflects real fills.
What is a good profit factor for new traders? A profit factor between 1.3 and 1.6 is workable for most beginners, and 1.5 to 1.75 leaves a safety margin for live execution. A ratio above 3.0 on a small sample usually signals overfitting rather than a strong edge.
Profit factor vs expectancy: which matters more? They answer different questions and work best together. Profit factor measures total reward against total risk; expectancy measures the average dollar result per trade. Reading both, alongside sample size and drawdown, describes a strategy more honestly than either alone.
Why does profit factor matter in risk management? It exposes whether your wins justify your losses across the whole record, not just on the trades you remember. It also reveals fragility: a high ratio built on few trades or a single outlier is a risk warning, not a green light.
How many trades do you need for a reliable profit factor? Generally a few hundred closed trades. On 20 or 30 trades, one outlier can dominate the figure, so the ratio reflects luck and sequence more than a repeatable edge.
What profit factor is actually telling you
Profit factor is a clean, useful summary of whether a strategy earns more than it risks, and it deserves a place in every trading review. The formula is simple, the benchmarks are well understood, and the comparison against expectancy and win rate is straightforward.
The discipline is in reading it correctly. Check the trade count before you trust the ratio. Account for costs. Hold it next to drawdown and the market conditions that produced it. A profit factor is most reliable when you treat it as a question about your process rather than a grade on it. Reviewed that way, it does what a good metric should: it tells you where the edge is real and where it only looks real.
Worth the read?