
Resistance Level — How to Read It Before Price Reacts
A resistance level is where selling repeatedly caps an advance. Learn to read it as a zone, confirm it, and know when it stops mattering.
A resistance level is a price area where selling pressure has repeatedly stopped an advance, leaving a visible ceiling on the chart. Price approaches, sellers step in, and the move stalls or reverses. That is the whole idea in one sentence. The harder part, and the part most explanations skip, is knowing when a resistance level still matters and when it has quietly stopped mattering.
Most traders treat a resistance level as a fixed line and stop thinking. The level held once, so they assume it will hold again. Markets do not work on memory alone. A resistance level is a record of past behavior, not a promise about future behavior, and reading it well means watching how price reacts there now.
What a resistance level actually is
The resistance level meaning is straightforward. It is a price region where supply has overwhelmed demand often enough to turn price away. Each time buyers push into that area, sellers meet them, and the advance fails to hold. The chart prints a high, then a lower close, and the pattern repeats.
What creates that supply matters more than the line itself. Some sellers are taking profit. Some are traders who bought higher, got trapped, and are now selling to break even. Some are larger participants defending positioning. The level is where those decisions cluster. When you mark a resistance level, you are marking a zone of collective hesitation, not a magic number.
How to identify a resistance level on a chart
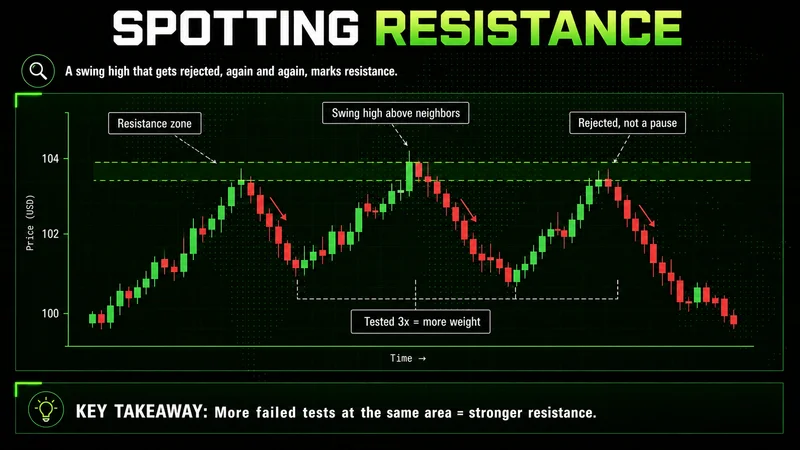
To identify a resistance level on a chart, find the swing highs where price stopped and reversed. A clean resistance level chart example shows two or more peaks at a similar price, each followed by a pullback. Connect those highs and you have your zone.
The adjacent bars confirm it. A genuine swing high sits above the bars on either side of it, which tells you price reached that area and was rejected rather than simply pausing. The more times price has tested the same area and failed, the more weight that resistance level carries.
Recency matters too. A level tested last week describes current positioning. A level from eight months ago describes participants who have mostly moved on. Both can hold, but the recent one tells you more about who is active right now.
A resistance level is a zone, not a line
Here is where the resistance level vs resistance zone distinction earns its place. Price rarely respects a single tick. It reacts to an area, and treating that area as one exact line is how traders get trapped.
Think of it this way. If your resistance level is 152 but price wicks to 152.40 before reversing, a line-thinker calls the level broken and bails or flips. A zone-thinker saw the rejection inside the area and read it as confirmation. The second reading is usually closer to how price behaves. Mark resistance as a band wide enough to absorb normal noise, narrow enough to still mean something.
This is also why exact stop placement directly on the line gets run so often. The line is an approximation. The zone is the structure.
The timeframe decides which resistance levels matter
The best timeframe for resistance level analysis is not a single answer. It depends on how long you intend to hold. A scalper's resistance on the five-minute chart is noise to a swing trader, and a swing trader's weekly resistance is invisible to a scalper watching ticks.
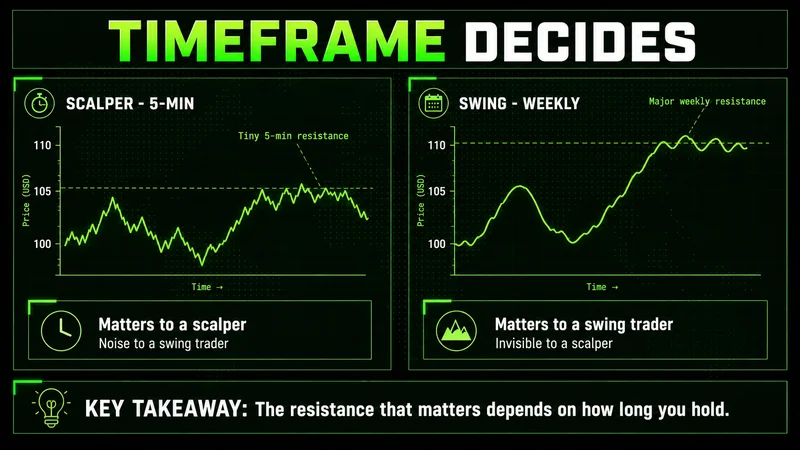
The practical approach is to read at least two timeframes. The higher timeframe tells you where the meaningful resistance level sits. The lower timeframe tells you how price is reacting as it arrives. When a lower-timeframe level lines up with a higher-timeframe level, that confluence is where the strongest reactions tend to happen. When they disagree, the higher timeframe usually wins.
Confirming a resistance level before you act
Knowing how to confirm a resistance level before entering a trade is what separates a plan from a guess. The level marks where to pay attention. The reaction tells you whether anything is actually happening. A resistance level trading strategy built on confirmation waits for the second part.
This is a short resistance level checklist for new traders to run before committing:
- The area has at least two prior rejections, not one isolated high.
- Price is reacting now — a stall, a wick, a lower close into the zone — not just sitting near it.
- The level aligns across at least two timeframes you actually trade.
- Your invalidation is defined: a clear close above the zone, with acceptance, means the read is wrong.
- The risk on the trade is sized so that being wrong here is an operational cost, not an emotional event.
Confirmation is not certainty. It is evidence that the resistance level is doing something before you risk capital on it.
Where reading resistance breaks down
This is the part the glossary definitions leave out. Resistance reads cleanly while volatility stays contained. The moment a catalyst hits — a data release, a Fed decision, a liquidity event overnight — those carefully marked levels can become irrelevant in a single bar. Price can slice through three prior zones without pausing because the participants who defended them are no longer the ones in control.
Gold shows this constantly. It can respect a resistance level for hours, trading technically and cleanly, then invalidate the entire structure within minutes when macro volatility expands. The level was not wrong. The condition changed, and the level stopped describing the market.
The common resistance level mistakes beginners make all trace back to this. They trust the line during conditions that no longer support it. They fade strong momentum into resistance without asking what is driving the move. They mistake a level that worked in a quiet range for one that will hold through a news-driven expansion. A resistance level is context-dependent. Read it without the surrounding context and you are not analyzing the market; you are guessing at it with a more technical vocabulary.
FAQs
What is a resistance level in trading? It is a price area where selling has repeatedly stopped an advance, forming a ceiling on the chart. Buyers push into it, sellers absorb the pressure, and price tends to stall or reverse there.
Resistance level explained for beginners — how is it different from support? Resistance sits above current price and tends to cap rallies, while support sits below and tends to hold declines. When a resistance level breaks with acceptance, it often becomes support afterward.
How do I identify the importance of a resistance level? Weigh the number of prior rejections, how recent they are, and whether the level lines up across timeframes. More tests, more recency, and timeframe confluence all add weight.
How does a resistance level affect trading risk? It gives you a defined point of invalidation. If you trade near resistance, a clean close above the zone tells you the read is wrong, so you can size and place risk around a logical level instead of a guess.
Does a resistance level work on every timeframe? It works on the timeframe it formed on. A five-minute resistance level means little to a swing trader, and a weekly level barely registers for a scalper. Match the level to your holding period.
Keep building your chart reading
A resistance level is a starting observation, not a complete trade. Read it as a zone, confirm it across the timeframes you trade, and stay aware of the conditions that can make it irrelevant. From here, the natural next steps are studying support and role reversal, swing-high structure, and how liquidity behaves around obvious levels. Each one sharpens how you read the same chart you are already watching.
Worth the read?


