
Revenue Analysis — What the Top Line Really Tells You
Revenue analysis reads a company’s top line for trend, source mix, and the cash behind it, not just the reported number. Here is how to do it well.
Revenue analysis is the work of reading a company's top line for what it actually means: where the sales came from, whether they are durable, and what would have to break for them to stop. Most beginners stop at the number. The number alone tells you almost nothing. A single quarter of rising revenue can hide a falling-apart business, and a flat line can hide a company quietly getting stronger. The signal lives in the trend, the mix, and the cash behind it.
That gap between the reported figure and the real story is why revenue analysis matters more than the headline most people react to. Price often moves on the surprise. Position and durability decide what happens next.
What revenue analysis means in plain terms
Revenue is the money a company brings in from selling its products or services before any costs are subtracted. It sits at the top of the income statement, which is why analysts call it the top line. Revenue analysis is the process of studying that figure across time and across its sources to judge the health and direction of the business.
The intent is not to admire growth. It is to understand it. Revenue can rise because a company sold more units, raised prices, acquired a competitor, or pulled future sales forward with discounts. Each of those reads differently. Treating them as the same thing is how people misprice a stock.
The components and formula behind the top line
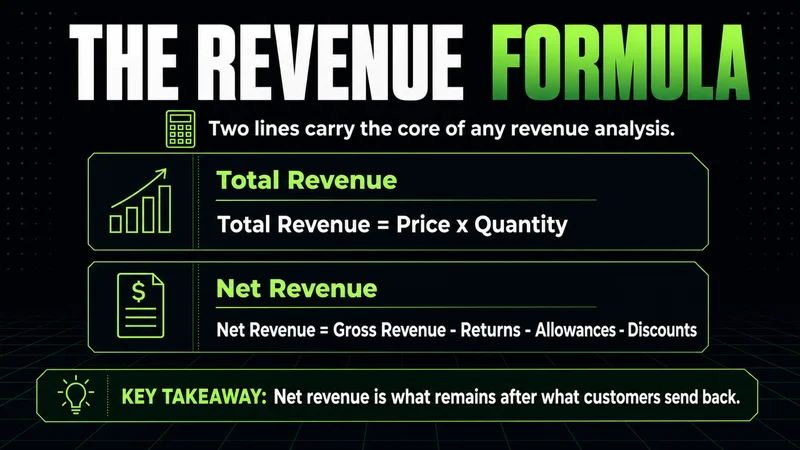
At its simplest, the revenue formula is straightforward.
- Total revenue equals price multiplied by quantity sold.
- Net revenue equals gross revenue minus returns, allowances, and discounts.
Those two lines carry the core components of any revenue analysis: how much a company charges, how many units it moves, and how much of the reported figure survives after customers send product back or negotiate the price down. Net revenue is the more honest number. A company can post strong gross sales and still show weak net revenue once heavy discounting is stripped out.
Beyond the formula, the components worth separating are operating revenue, which comes from the core business, and non-operating revenue, which comes from interest, asset sales, or one-time events. A clean analysis keeps those apart. Operating revenue tells you whether the business works. Non-operating revenue tells you whether the quarter was flattered by something that will not repeat.
How to read revenue analysis across time
A single period is a snapshot. Revenue analysis lives in the comparison. Reading it well means lining up at least three consecutive periods and asking what the direction is.
- Calculate the year-over-year percentage change and watch whether it is accelerating or decelerating.
- Compare revenue growth against the growth in operating expenses; expenses outrunning revenue is an early warning.
- Check whether reported revenue is converting into operating cash flow, not just sitting in receivables.
This is the interpretation layer, and it is where most of the value is. Growth that decelerates for three straight quarters is a different signal than a single soft print. A company whose revenue rises while operating cash flow stalls is telling you the sales are not yet real money. The trend, the mix, and the cash conversion together form the actual read.
A worked revenue analysis example for investors
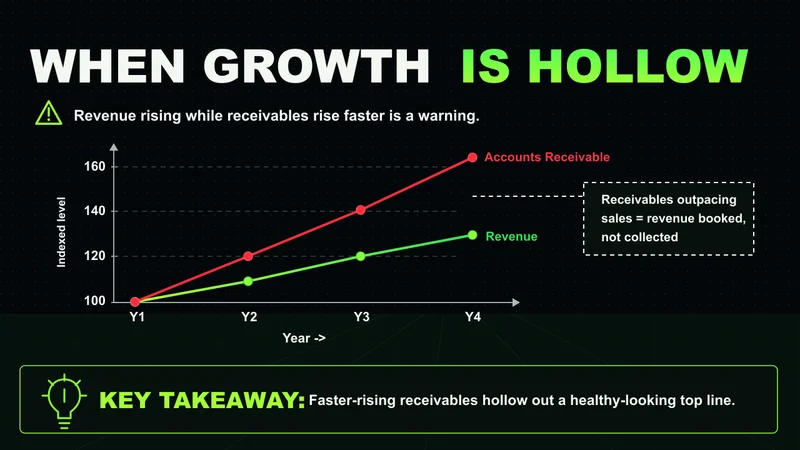
Consider a company that reports revenue rising from one year to the next while its accounts receivable rise faster than sales. On the surface, the top line looks healthy. Underneath, the business is booking revenue it has not collected. That divergence is one of the most reliable revenue analysis red flags an investor can find, because cash is far harder to manufacture than a reported sales figure.
Now picture the cleaner version. Revenue grows steadily, operating expenses grow slower, and operating cash flow tracks reported revenue closely. The mix is weighted toward recurring operating revenue rather than one-time asset sales. That is the profile of a business where the growth is structurally supported rather than borrowed from the future.
The discipline here is the same one that governs good trading. You are reacting to what the statements show, not predicting what management hopes. Revenue analysis is reactive, not predictive, and that is its strength.
The cash flow statement is harder for management to manipulate than the income statement, which is exactly why revenue that does not turn into cash deserves suspicion.
Common revenue analysis red flags to watch for
Some patterns recur often enough to function as a checklist. None of them is a verdict on its own. Together they shift the probability.
- Receivables growing materially faster than revenue, which suggests sales are not converting to cash.
- Operating expenses rising faster than revenue, which compresses margins regardless of the headline growth.
- A widening gap between net income and operating cash flow over several periods.
- Heavy reliance on non-operating or one-time revenue to hit a number.
- Increasing complexity or opacity in how revenue is described, which often hides something the company would rather you not weigh.
Revenue analysis vs earnings analysis explained
Revenue analysis and earnings analysis answer different questions, and conflating them is a common mistake. Revenue measures the scale of business activity at the top line. Earnings measure what is left after costs, taxes, and interest at the bottom line.
A company can grow revenue while earnings shrink, usually because costs are rising faster than sales. The reverse also happens: earnings can climb on cost cutting while revenue stagnates, which is not a growth story but an efficiency one with a ceiling. Revenue analysis tells you whether demand for the business is expanding. Earnings analysis tells you whether that demand is being converted into profit. You need both, and you should never let a strong figure in one substitute for weakness in the other.
When revenue analysis stops working
Revenue analysis is only as good as the comparability behind it. It breaks down the moment the periods you are comparing are not the same shape. A company that makes a large acquisition prints higher revenue that has nothing to do with organic demand, and a naive year-over-year read will mistake the deal for growth. The same distortion appears around accounting changes, currency swings for international businesses, and businesses with heavy seasonality where one quarter cannot be compared to the last. In those conditions the trend you think you are reading is an artifact, and the framework that usually protects you quietly inverts. Strip out the one-time effects first, or the analysis misleads with confidence.
FAQs
What is revenue analysis in simple terms? It is the practice of studying a company's revenue over time and across its sources to judge whether the business is genuinely growing, what is driving the change, and how durable that growth is. It looks past the single reported figure to the trend, the mix, and the cash behind it.
What is the difference between revenue analysis and earnings analysis? Revenue analysis measures the top line, the total sales a business generates before costs. Earnings analysis measures the bottom line, what remains after costs, taxes, and interest. Revenue shows whether demand is expanding; earnings show whether that demand turns into profit.
What are the most common revenue analysis red flags? Receivables rising faster than revenue, operating expenses outpacing revenue, reported revenue that does not convert into operating cash flow, and heavy reliance on one-time or non-operating sales. Any one can be benign; several together raise the probability of a problem.
How many periods should a revenue analysis cover? At least three consecutive periods, such as three annual or quarterly reports. A single period is a snapshot and cannot show direction. The trend across multiple periods is where the real signal lives.
What revenue analysis comes down to
Revenue analysis is less about the number and more about its context. Read the trend across several periods, separate operating revenue from one-time sources, and confirm that reported sales are turning into cash. Treat fast-growing receivables and costs outrunning revenue as warnings, not noise. Done with that discipline, revenue analysis stops being a definition you memorize and becomes a lens that tells you whether a business is actually working.
Worth the read?


