
Unemployment Rate Formula — What It Measures
The unemployment rate formula divides the unemployed by the labor force times 100. Here is how it is calculated and why traders read past the headline.
The unemployment rate formula is simple: divide the number of unemployed people by the total labor force, then multiply by 100. The labor force is everyone working plus everyone actively looking for work. That single percentage drives more headlines, and more market reactions, than almost any other monthly number.
Most people stop at the arithmetic. Traders cannot afford to. The formula is clean, but the inputs behind it are full of judgment calls, and those judgment calls are exactly where the number stops telling the truth about the economy.
What the unemployment rate formula actually measures
The unemployment rate measures the share of the labor force that is jobless and actively seeking work. It does not measure how many people are out of work in total. That distinction is the entire meaning of the number.
To be counted as unemployed, a person has to be jobless, available to work, and actively looking. Someone who stopped searching is not unemployed by this definition. They leave the labor force entirely and disappear from the denominator. So the rate can fall for two opposite reasons: more people found jobs, or more people gave up looking. The formula treats both the same way.
This is why the headline rate, the one labeled U-3, is a starting point, not a verdict. It tells you the proportion, not the context behind it.
How the unemployment rate formula is calculated, step by step
The calculation runs in a fixed order. Work it the same way every time.
- Count the employed: everyone who did any paid work in the survey week, plus those temporarily away from a job.
- Count the unemployed: those without a job who were available and actively searching in the prior four weeks.
- Add the two to get the labor force.
- Divide the unemployed by the labor force, then multiply by 100.
A worked example makes the calculation concrete. Suppose a simplified economy has the following counts.
| Category | People |
|---|---|
| Employed | 152,000,000 |
| Unemployed | 8,000,000 |
| Labor force (employed + unemployed) | 160,000,000 |
| Not in labor force | 100,000,000 |
The unemployment rate is 8,000,000 divided by 160,000,000, multiplied by 100, which equals 5%. Notice that the 100,000,000 people not in the labor force never touch the rate at all. Students, retirees, and discouraged workers sit outside the formula by design.
The data itself comes from the monthly household survey of roughly 60,000 homes, not from a headcount of every worker. The number is a sample-based estimate, which is part of why it gets revised.
Unemployment rate versus employment rate
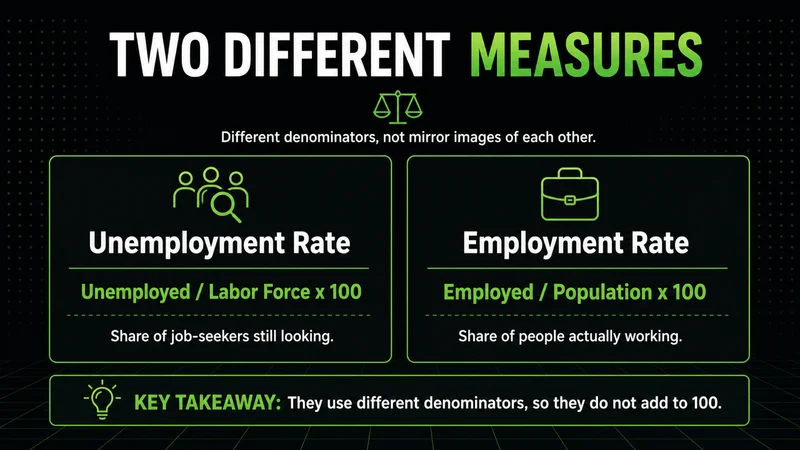
The unemployment rate and the employment rate answer different questions, and confusing them leads to bad reads. The three labor-market ratios use different denominators.
- Unemployment rate: unemployed divided by the labor force.
- Employment-to-population ratio: employed divided by the entire working-age population.
- Labor force participation rate: labor force divided by the entire working-age population.
The unemployment rate uses the labor force as its denominator. The employment-to-population ratio uses the entire working-age population. Because the second ignores the active-search test, it captures people the unemployment rate quietly drops. When workers leave the labor force, the unemployment rate can improve while the employment rate stays flat or falls. Reading the two together tells you whether a falling rate reflects hiring or withdrawal.
The labor force participation rate sits alongside both. It measures how many working-age people are in the labor force at all. A drop in participation is the usual reason a falling unemployment rate is not the good news it appears to be.
Why the print moves stocks and how traders read it
The unemployment rate matters to markets because it is a primary economic indicator the Federal Reserve watches when setting rate policy. A labor market that runs hot pressures the Fed toward tighter policy; a softening one opens room to ease. Equity and index futures price those expectations within seconds of the release.
The number does not move price on its own. Positioning does. The release resolves uncertainty, and the resolution forces traders who were leaning the wrong way to cover. That is the real mechanism behind the volatility, not the percentage itself.
The first move after a major economic release is rarely the cleanest opportunity. Liquidity is thin, spreads widen, and the initial spike often reverses once the full report is digested.
Reacting to the headline number alone is reactive in the worst sense. The disciplined read waits for structure to form after the spike, then trades the acceptance or rejection of a level rather than the print. Treating the unemployment rate as a trading signal means treating it as context for positioning, not as an entry trigger by itself.
Where the headline number misleads
The formula has real limitations, and knowing them is the difference between using the number and being used by it.
- It excludes discouraged workers who stopped searching, so a falling rate can hide a shrinking labor force.
- It counts part-time workers who want full-time hours as fully employed, which the broader U-6 measure corrects.
- It is a survey estimate, so it carries sampling error and gets revised in later months.
- It is a lagging snapshot of one week, not a real-time read on momentum.
The headline rate reads cleanly in a stable labor market where participation holds steady. In a recovery where people flood back into the labor force, the same formula can show the rate rising even as hiring accelerates, because the denominator grows faster than jobs are filled. That is the condition where the number inverts on you: a rising rate that is actually a sign of confidence returning. Read it without participation and you read it backward.
What to watch around the next jobs report
The unemployment rate formula is worth understanding precisely because the output is so easy to misread. The arithmetic is trivial; the interpretation is not.
Before the next release, three numbers are worth pairing with the headline rate: labor force participation, the broader U-6 underemployment measure, and the prior month's revision. Together they tell you whether a move in the rate reflects a real shift in the labor market or just a change in who is counted. For a working trader, that context decides whether the print is information or noise.
Worth the read?


