
Solvency Ratio — What It Tells You About a Company
The solvency ratio measures whether a company generates enough cash flow to cover its long-term debt. Here is how to calculate and read it well.

The solvency ratio measures whether a company generates enough cash flow to cover all of its debt over the long term. It divides after-tax net income plus non-cash expenses by total liabilities, both short-term and long-term. A higher result means the business can carry its obligations from operations rather than from new borrowing. That single number is where most balance-sheet analysis should start, and where most readers stop too early.
Most explanations of the solvency ratio treat it as an accounting definition and leave it there. The number matters, but the context around it matters more. A company can post a clean solvency ratio one year and still be one refinancing window away from trouble. The work is reading the figure against the debt schedule, the industry, and the conditions the business actually operates in.
What the solvency ratio measures
Solvency is the ability to meet long-term obligations as they come due. The solvency ratio puts a number on that ability by comparing the cash a business produces to the debt it owes. Net income alone understates real cash flow because it subtracts depreciation and amortization, expenses that never leave the bank account. Adding those non-cash charges back gives a closer estimate of what the company can actually use to service debt.
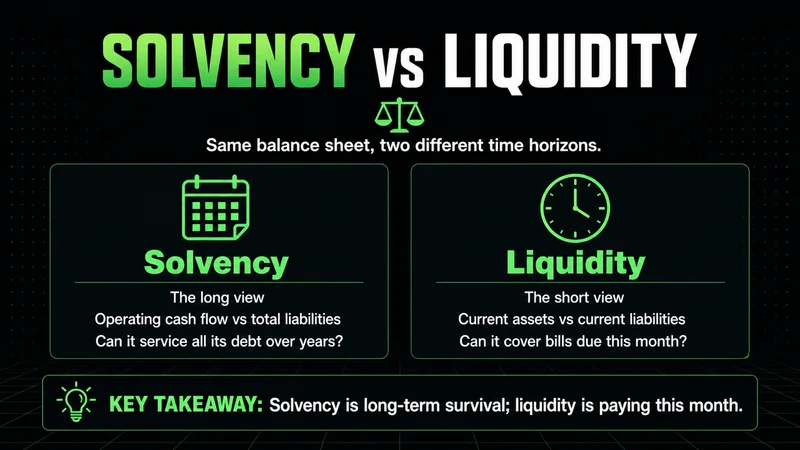
This is different from liquidity. Liquidity asks whether a company can pay its bills over the next few months. Solvency asks whether the business model can carry the full debt load over years. A company can be liquid and still insolvent, and the gap between those two states is where a lot of capital gets lost.
The solvency ratio formula and how to calculate it
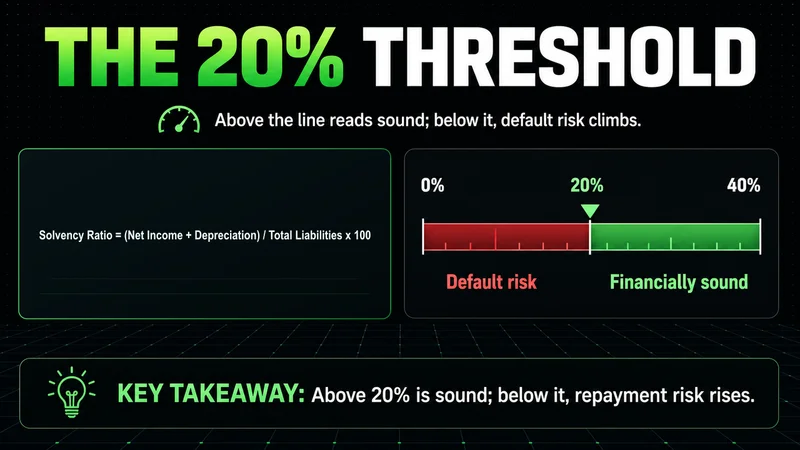
The most common version of the solvency ratio formula is straightforward:
- Start with after-tax net income for the period.
- Add back non-cash expenses, primarily depreciation and amortization.
- Divide that figure by total liabilities, the sum of short-term and long-term obligations.
The result is usually expressed as a percentage. If a company earns 8 million in after-tax income, carries 2 million in depreciation, and owes 40 million in total liabilities, the solvency ratio is 10 million divided by 40 million, or 25%. The calculation pulls directly from the income statement and the balance sheet, so it takes minutes once you know where the inputs live.
The inputs are simple. The judgment is not. The same 25% reads very differently for a software business with no hard assets than for a utility carrying decades of capital debt.
What a good solvency ratio looks like
As a general benchmark, a solvency ratio above 20% is treated as financially sound, and a figure below that range raises the risk of default. Lenders lean on this threshold because they want to confirm a borrower throws off enough excess cash flow to repay credit without stress.
The benchmark is a starting point, not a verdict. Acceptable solvency varies widely by sector. Capital-intensive industries such as utilities, telecom, and manufacturing run higher debt loads by design, so a ratio that looks thin in software can be normal in infrastructure. The useful comparison is rarely against a fixed number. It is against direct competitors and against the same company's own history over several years. A solvency ratio drifting lower across consecutive reporting periods says more than any single reading.
How investors actually read the solvency ratio
This is where most explainers stop and where the practitioner work begins. A solvency ratio is one input in a screening process, not a conclusion. Treated as a standalone score, it invites the same mistake traders make with a single indicator on a chart: certainty that the data does not support.
Reading the ratio in context means a few concrete checks:
- Compare the figure to sector peers, not to a universal benchmark.
- Track the trend across at least three years, not one snapshot.
- Cross-reference it with the debt maturity schedule to see when obligations actually come due.
Indicators are tools, not decision-makers. A solvency ratio confirms or challenges a thesis; it does not replace the work of building one.
The ratio earns its place when it is combined with liquidity measures, the maturity calendar, and the quality of the underlying earnings. A business with a healthy ratio but a wall of debt maturing in a single year is carrying a risk the headline number hides.
Solvency ratio versus liquidity ratio
The two ratios answer different questions and are easy to confuse. Solvency is the long view. Liquidity is the short one.
- The solvency ratio asks whether the company can service all of its debt over years, using operating cash flow against total liabilities.
- A liquidity ratio, such as the current ratio or quick ratio, asks whether the company can cover obligations due within roughly a year, using short-term assets against short-term liabilities.
A business can pass one test and fail the other. Strong liquidity with weak solvency describes a company that can pay this quarter's bills but cannot sustain its debt structure. Strong solvency with weak liquidity describes a fundamentally sound business that could still stumble into a short-term cash crunch. Both readings matter, and neither substitutes for the other.
Where the solvency ratio breaks down
The solvency ratio is useful until the structure underneath it shifts, and then the same number can mislead. The most common failure is off-balance-sheet obligations: operating leases, pension shortfalls, and contingent liabilities that the total-liabilities figure may not fully capture. The ratio looks healthy because the denominator is incomplete.
It also depends on stable earnings. For a cyclical business, a single strong year can lift the ratio right before a downturn erases the cash flow that produced it. And the ratio says nothing about timing. A company can be solvent on paper while a refinancing window closes against it in a market where credit suddenly tightens. Solvency reads cleanly in calm conditions; under stressed credit markets, the same balance sheet can mean far less than the number suggests. The figure describes the long-run picture, not the moment a maturity comes due into a hostile market.
None of this makes the solvency ratio worthless. It makes it a measure that has to be read with its limits in view, the way any single data point should be.
FAQs
What is the solvency ratio in simple terms? It is a measure of whether a company produces enough cash flow to cover all of its debt over the long term. It divides after-tax income plus non-cash expenses by total liabilities, and a higher percentage signals a stronger ability to carry that debt.
What is a good solvency ratio? A figure above 20% is generally treated as financially sound, while a lower reading raises default risk. The benchmark varies by industry, so the more useful comparison is against direct competitors and against the company's own trend over several years.
How is the solvency ratio different from a liquidity ratio? The solvency ratio looks at long-term debt-paying ability using total liabilities, while a liquidity ratio looks at short-term obligations due within about a year. A company can be liquid in the short run yet insolvent over the long run, which is why both are read together.
What are the main limitations of the solvency ratio? It can miss off-balance-sheet obligations such as leases and pension gaps, it can be distorted by a single strong year in a cyclical business, and it says nothing about when debt actually matures. A clean ratio does not guarantee a company can refinance into a tight credit market.
The takeaway on reading solvency
The solvency ratio is a clear, fast read on long-term debt-paying ability: cash flow over total liabilities, with a rough 20% line separating sound from strained. The calculation is the easy part. The value comes from reading the number against sector peers, the multi-year trend, the debt maturity schedule, and the conditions the business operates in. Used that way, the solvency ratio is a reliable first filter. Used as a verdict on its own, it hides exactly the risks a careful analyst is trying to find.
Worth the read?


