
Total Asset Turnover Ratio — What It Reveals
The total asset turnover ratio measures sales generated per dollar of assets. Here is the formula, a worked example, and how to read it without being misled.

The total asset turnover ratio measures how much revenue a company generates for every dollar of assets it holds. You calculate it by dividing net sales by average total assets. A reading of 1.0 means the business produced a dollar of sales for each dollar of assets on its books. Higher generally signals tighter asset efficiency; lower signals the opposite. The number is simple. Reading it correctly is where most people slip.
The ratio is not a verdict. It is a question. A retailer turning assets at 2.5 and a utility turning them at 0.3 are not ranked by that gap alone, because their balance sheets are built for different jobs. Context decides what the figure is worth.
What the total asset turnover ratio actually measures
Think of total assets as the capital base a company was given to work with: cash, receivables, inventory, plant, equipment, and intangibles. The ratio asks how hard that base is working to produce sales. It is an efficiency read, not a profitability read. A company can turn assets quickly and still lose money on every sale.
That distinction matters. Turnover tells you about asset productivity. Margin tells you about pricing and cost control. You need both to understand a business, and the ratio in isolation answers only the first.
The total asset turnover ratio formula and calculation
The formula is direct:
Total Asset Turnover Ratio = Net Sales / Average Total Assets
Net sales are revenue after returns, discounts, and allowances. Average total assets smooth out a single-day snapshot by taking the beginning and ending balance for the period and dividing by two:
Average Total Assets = (Beginning Total Assets + Ending Total Assets) / 2
Using the average rather than the year-end figure matters when a company has raised capital, made an acquisition, or written down assets during the year. A large mid-year change distorts a point-in-time reading, and the average keeps the comparison honest.
A worked total asset turnover ratio example
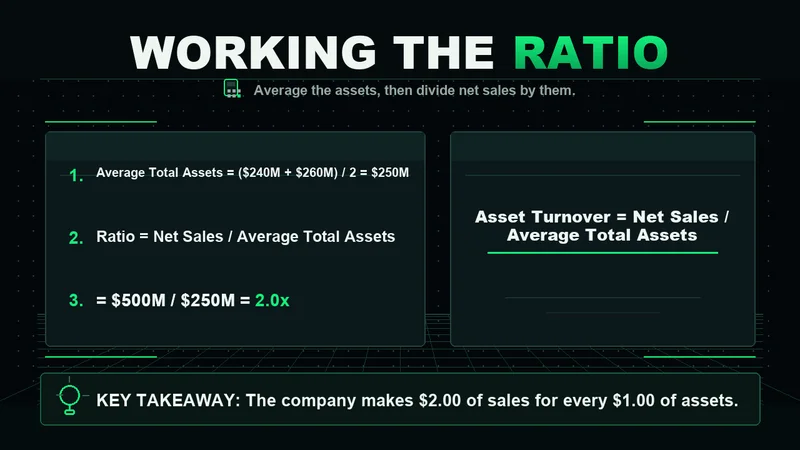
Suppose a company reports net sales of 500 million dollars. It began the year with 240 million in total assets and ended with 260 million. The average total assets are 250 million. Divide 500 by 250 and the ratio is 2.0.
That company generated two dollars of sales for every dollar of assets. To judge whether 2.0 is strong, you would line it up against the same company's prior years and against direct competitors. The single figure means little until it sits next to a reference point.
What is a good total asset turnover ratio
There is no universal good number, and any source that hands you one is skipping the part that matters. The useful benchmark is industry and history, not an absolute threshold.
- Asset-light businesses such as software, consulting, and many retailers carry lean balance sheets and tend to post higher ratios.
- Asset-heavy businesses such as utilities, telecom, airlines, and manufacturers hold enormous fixed-asset bases and structurally run lower.
- A ratio rising over several years can signal improving efficiency; a ratio falling can signal idle capacity, an oversized asset base, or softening demand.
The comparison has to be like for like. Holding a railroad to a software company's turnover is a category error, not analysis.
How investors actually use the total asset turnover ratio
Most explanations stop at the definition. In practice, the ratio earns its place inside the DuPont framework, where return on equity breaks into three parts: net profit margin, asset turnover, and financial leverage. Turnover is the efficiency lever in that chain.
That decomposition is where the ratio becomes useful for screening. Two companies can post the same return on equity for very different reasons. One earns it through fat margins on a slow asset base. Another earns it through thin margins on assets it turns quickly. The total asset turnover ratio tells you which engine is doing the work, and that changes how durable the return looks.
A number you cannot place against a peer and a trend is data, not insight. The ratio only starts to inform a decision once it has context around it.
When I am sizing up a name, I read turnover as one input among several, never as a standalone signal. Process over outcome applies to analysis as much as to execution: a single ratio that looks attractive in isolation has talked plenty of people into positions they did not understand.
Total asset turnover ratio versus fixed asset turnover ratio
The two ratios answer different questions. Total asset turnover uses the entire asset base. Fixed asset turnover uses only net property, plant, and equipment.
Fixed asset turnover isolates how well a company sweats its long-lived productive assets, which is most revealing in capital-intensive industries where plant and equipment dominate the balance sheet. Total asset turnover gives the full-base view, including the working capital tied up in receivables and inventory. Read together, a high fixed-asset turnover paired with a low total turnover points to capital trapped in current assets rather than in plant.
Where the total asset turnover ratio breaks down
The ratio has real limitations, and ignoring them is how the number misleads.
It is distorted by the age of a company's assets. A firm running fully depreciated equipment shows a small asset base and an inflated turnover that flatters efficiency it does not actually have. A competitor that just invested in new plant looks worse on the same metric while being better positioned. The accounting, not the operations, is driving the gap.
It is also blind to seasonality and to one-time balance-sheet events. A company sitting on a large cash pile after a raise will show depressed turnover until that cash is deployed, even though nothing about the operating business has weakened. And the ratio says nothing about profit. A business can turn assets aggressively while selling below cost. Efficiency without margin is just fast erosion.
The figure works as a comparison tool inside an industry and across a company's own history. Pulled out of that frame, it stops describing anything you can act on.
A short checklist before you trust the number
- Use average total assets, not the year-end snapshot, when the balance sheet moved materially during the period.
- Compare only within the same industry, then against the company's own multi-year trend.
- Check asset age, because heavy depreciation inflates the ratio.
- Pair turnover with margin before drawing any conclusion about quality.
Run those four checks and the ratio becomes a usable input. Skip them and it becomes a confident-looking number pointing in the wrong direction.
Related reading
The total asset turnover ratio sits inside a wider set of efficiency and profitability tools. Fixed asset turnover, the DuPont breakdown of return on equity, inventory turnover, and net profit margin each isolate a different part of the same picture. Read alongside those, turnover stops being a trivia figure and starts shaping how you judge a business.
Worth the read?


