
Support in Trading — How to Read It on a Chart
Support in trading is a price zone where buyers stop a decline. Learn to identify it, confirm it, and define your risk around support on any chart.
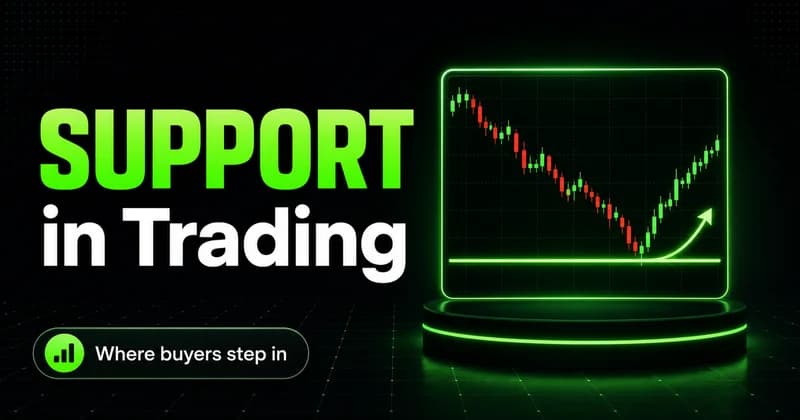
Support in trading is a price area where buyers have repeatedly absorbed selling and stopped a decline. It is not a magic floor. It is a zone where demand showed up before, and where it might show up again. Most traders treat support as a guarantee. It is closer to a probability, and that distinction decides whether the level helps you or costs you.
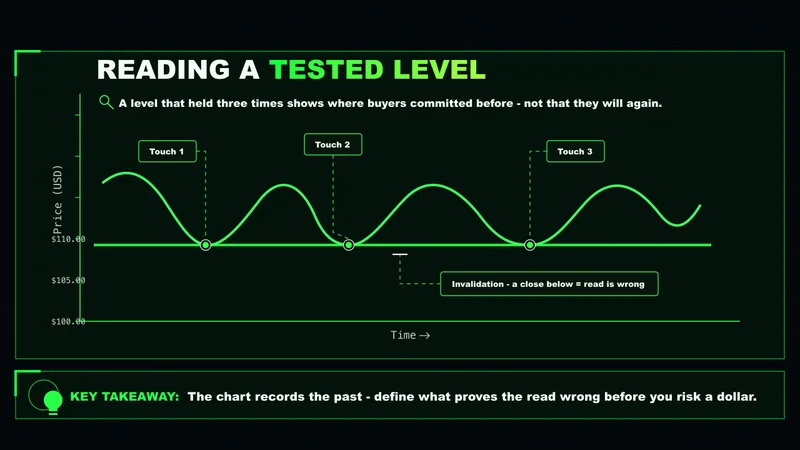
A level that held three times tells you something real about where buyers have been willing to commit capital. It does not tell you they will commit again. The chart records the past. Your job is to read what that record implies about the present, then define what would prove the read wrong before you risk a dollar on it.
What support means when you read a chart
Support is the price area where a downward move tends to stall because buying pressure becomes strong enough to absorb the selling. The market stops falling, finds buyers, and either reverses or pauses. That reaction leaves a visible mark on the chart: a swing low, a wick, a base that price refused to break below.
The support meaning that matters in live trading is behavioral, not mechanical. A level holds because participants who bought there before are willing to defend it, and new buyers see the same area as fair value. When enough of them act at once, demand overwhelms supply and price lifts. When they hesitate, the level breaks. You are reading positioning and intent through price, not predicting a fixed outcome.
This is why context matters more than the line itself. Support inside a strong uptrend behaves differently from support inside a downtrend that is merely pausing. The same horizontal line means two different things depending on what the broader structure is doing around it. Read the structure first. The level is the second question, not the first.
Why support is a zone, not a single line
Beginners draw support as one precise price. The market rarely respects a single tick. Price overshoots, wicks below, and reclaims. It stops a few points early on one test and a few points late on the next. Treating support as an exact number sets you up to be stopped out by noise that never invalidated your idea.
A more honest read is a zone. Mark the area where reactions clustered, not the single low. A reasonable support zone spans from the lowest wick of the cluster to the bodies that closed nearby. Inside that band, price is doing what it has done before: testing demand. Below the band, something has changed.
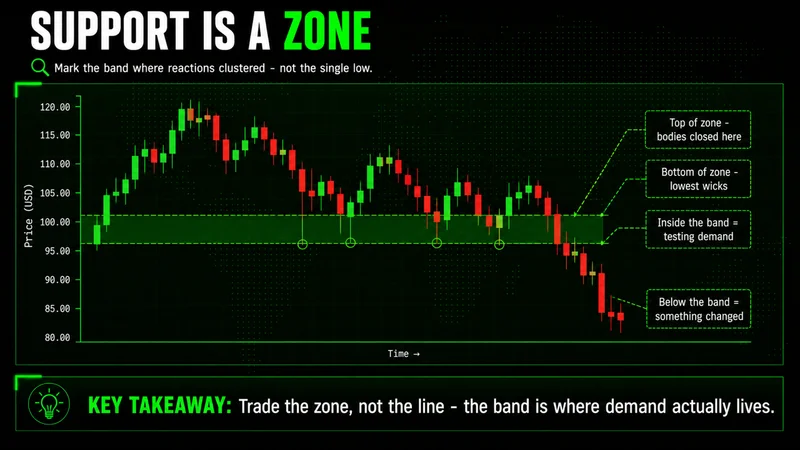
Thinking in zones also fixes your risk. If you treat support as a line, your stop sits one tick under it and gets clipped constantly. If you treat it as a zone, your invalidation sits below the entire band, where a break actually means buyers failed. The zone defines both the read and the risk in one decision.
How to identify support on a chart
Finding support is a process of locating where price reversed and counting how often the area mattered. The mechanics are simple. The discipline is in not forcing levels that are not there.
Here is the sequence I use when marking support on a fresh chart:
- Start on the higher timeframe and find the obvious swing lows where price clearly reversed.
- Mark the area, not the exact price, by drawing a band across the cluster of wicks and closes.
- Count the touches. Two reactions make a possible level. Three or more well-spaced reactions make a level worth trading.
- Note what price did after each touch. A sharp rejection is stronger evidence than a slow drift higher.
- Drop to your execution timeframe only after the higher-timeframe zones are marked.
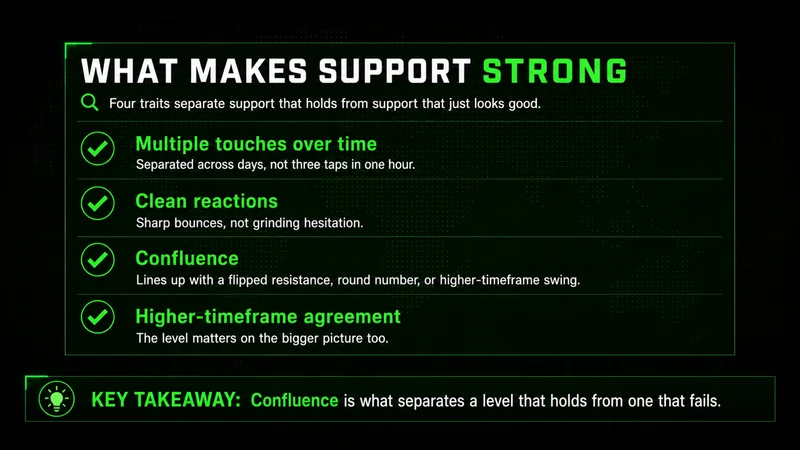
The strongest support areas share a few traits. They have multiple touches separated in time, not three taps in the same hour. They produced clean reactions rather than grinding hesitation. And they line up with something else on the chart, such as a prior resistance level that flipped, a round number, or a higher-timeframe swing. Confluence is what separates a level that holds from one that looks good and fails.
A quick support chart example makes this concrete. Suppose a stock sells off to 48, bounces hard, sells back to 47.80 a week later, bounces again, then revisits 48.10 a month after that and holds. You do not have a line at 48. You have a demand zone roughly between 47.75 and 48.15 that has absorbed selling three separate times. That is a support example for beginner traders worth more than any indicator reading.
Support vs resistance, and why the roles flip
Support and resistance are the same concept viewed from opposite sides. Support sits below price, where demand has stopped declines. Resistance sits above price, where supply has stopped advances. The behavioral logic is identical: an area where one side repeatedly overwhelmed the other.
The detail most beginners miss is that the roles flip. When price breaks below support and stays there, that old support frequently becomes resistance on the next move up. Sellers who were trapped long at the level want out at breakeven, and new sellers see the area as proven supply. The reverse is also true: broken resistance often becomes support. This is one of the most reliable behaviors in technical analysis, and it is why marking old levels remains useful long after they break.
| Aspect | Support | Resistance |
|---|---|---|
| Location | Below current price | Above current price |
| Dominant force | Buyers absorbing selling | Sellers absorbing buying |
| What a hold implies | Demand is defending the area | Supply is capping the area |
| After a confirmed break | Often flips to resistance | Often flips to support |
Support vs resistance explained this way removes the mystery. You are not tracking two different tools. You are tracking which side of the level price sits on, and which group of participants is trapped or in control.
How to confirm support before entering a trade
Touching a level is not a signal. A level that price approaches is information; a level that price reacts to is a setup. Confirmation is the difference, and skipping it is the most common reason beginners lose at otherwise valid areas.
Support confirmation means waiting for price to show that buyers are actually present, not just hoping they are. The forms it takes:
- A strong rejection candle off the zone, such as a long lower wick or a wide-range reversal bar that closes back inside the area.
- A shift in lower-timeframe structure, where price stops making lower lows and prints a higher low above the zone.
- A reclaim, where price dips into or just below the zone and then closes back above it with conviction.
- A volume reaction, where the bounce off support arrives on heavier participation than the decline into it.
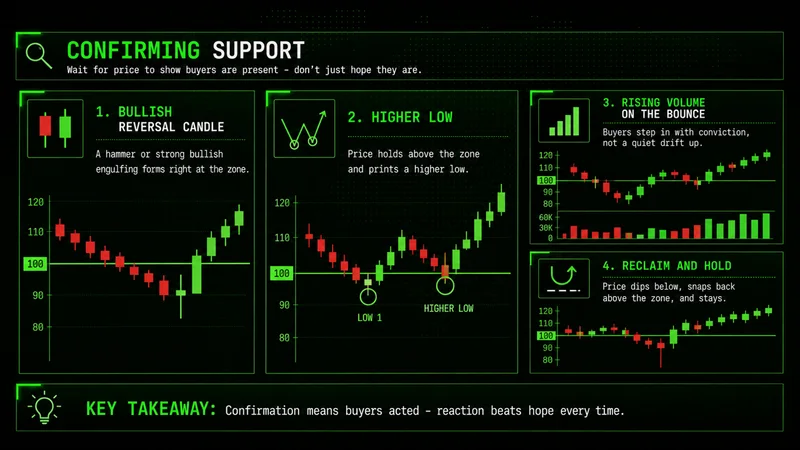
Most failed entries at support fail because the trader entered on touch instead of on confirmation. The level got hit, the entry felt obvious, and price kept going. Chasing a level without a reaction is gambling with better vocabulary. Waiting for confirmation costs you a few points of the move and saves you from the breaks that look identical until the candle closes.
Confirmation also gives you a clean invalidation. If you enter on a reclaim of the zone, your idea is wrong the moment price closes back below it. That is a defined risk, not a feeling. A support trading strategy built on confirmation is really a strategy built on knowing exactly when to be out.
How support shapes your risk and position size
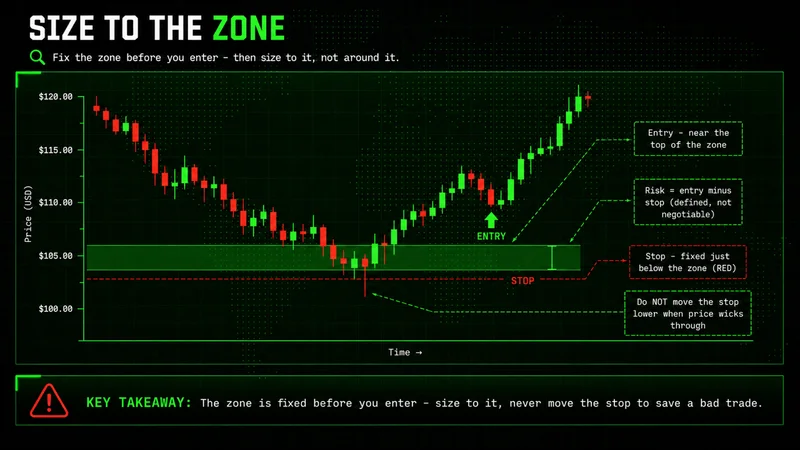
Support is where your risk gets defined, which is the practical reason it matters at all. The level tells you where your idea is wrong, and the distance from your entry to that point tells you how much you can size.
If support sits at 48 and you plan to risk to 47.50, your stop distance is fifty cents. That number, not your account balance or your conviction, sets your position size. A wider zone means a wider stop and a smaller position for the same dollar risk. A tighter zone lets you size up. The level does the math for you once you respect it as the invalidation point rather than a hopeful entry.
This is also where most accounts quietly get into trouble. A trader likes a level, enters without confirmation, then moves the stop lower when price wicks through because the level "should" hold. The risk was never defined; it was negotiable. How support affects trading risk comes down to one rule: the zone is fixed before you enter, and you size to it, not around it.
When support stops working
No level holds forever, and pretending otherwise is how good reads turn into bad losses. Support is a record of past demand. The moment that demand is gone, the level is just a line on a screen.
Support reads cleanly in normal, liquid conditions during regular hours. The same level means almost nothing in thin overnight liquidity or in the first minutes after major news, when a single large order can slice through three marked zones before any buyer steps in. In high-volatility expansion, levels that held all week get erased in minutes. I have watched gold trade technically against a support zone for hours, then invalidate the entire structure within a few minutes once a macro headline expanded volatility. The level was real until the regime changed. Then it was irrelevant.
Timeframe is the other place support quietly fails you. A level that looks decisive on the 5-minute chart can be meaningless on the daily, and a daily level can absorb dozens of intraday breaks that would have stopped you out if you traded the lower timeframe in isolation. The best timeframe for support analysis is the one that matches your holding period, confirmed against the timeframe above it. Trade the level you can actually hold through, not the one that looks cleanest in the moment.
When price breaks a confirmed support zone and accepts below it, the read is simply over. Acceptance, not a single wick, is the signal. A reclaim back above the zone within a bar or two can be a fakeout worth fading. Sustained closes below, on rising participation, mean the buyers who defended that area are gone. At that point the zone has flipped, and forcing the old long thesis is how a small operational loss becomes a large emotional one.
Common support mistakes beginners make
The errors at support are predictable, which means they are avoidable. Most of them come from treating the level as certainty instead of probability.
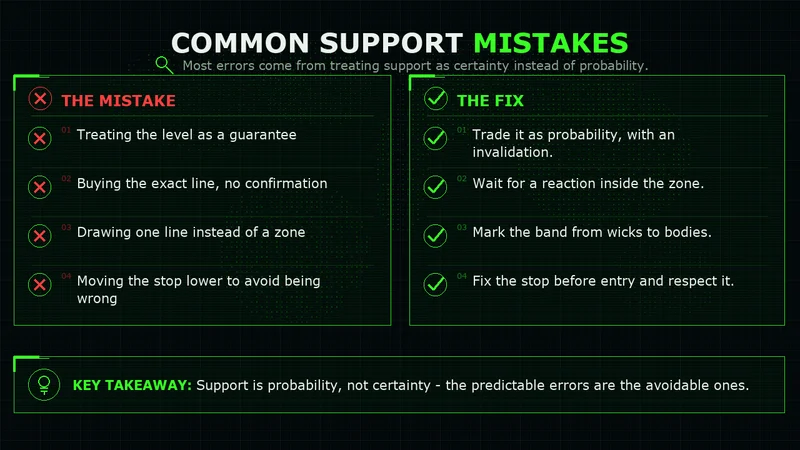
The support mistakes that show up most often:
- Drawing too many levels, until every candle sits near a line and none of them mean anything.
- Treating support as an exact price and getting wicked out of valid ideas by noise.
- Entering on touch instead of on confirmation, then watching price cut straight through.
- Ignoring the higher-timeframe trend, so a level gets bought inside a clean downtrend that was never going to reverse there.
- Moving the stop after entry because the level "should" hold, which turns defined risk into open-ended risk.
A simple support checklist for new traders keeps these in check before you commit: Is the zone marked on the higher timeframe first? Does it have at least two well-spaced reactions? Is there confluence with another level or structure? Did price confirm with a reaction rather than just touch? Is the trend behind it, or against it? If a level cannot answer those questions, it is not a level worth your capital. Discipline at this stage is what separates a trader who uses support from one who is used by it.
The level is never the edge. The edge is having the patience to wait for confirmation and the discipline to be wrong quickly when the zone breaks.
FAQs
What is support in trading in simple terms? Support is a price area where buyers have repeatedly stepped in and stopped a decline. It is a zone where demand showed up before and may show up again, not a guaranteed floor under the market.
How do I confirm support before entering a trade? Wait for price to react at the zone rather than just touch it. A strong rejection candle, a higher low on the lower timeframe, or a reclaim that closes back above the zone all show buyers are present and give you a defined point where the idea is wrong.
What is the difference between support and resistance? They are the same concept from opposite sides. Support sits below price where buyers absorb selling; resistance sits above price where sellers absorb buying. When a level breaks with acceptance, support often flips to resistance and resistance often flips to support.
The takeaway on trading support
Support is a probability, not a promise. It marks where demand has lived before, and reading it well means marking the zone on the higher timeframe, demanding confluence, and waiting for confirmation before you risk anything. The level defines your invalidation, and your invalidation defines your size.
The traders who lose at support are the ones who treat it as certainty: they buy the touch, widen the stop, and ignore the trend behind the level. The traders who use it well treat it as one input in a process. They know the zone can break, they know exactly when their read is wrong, and they are out the moment price proves it. Master that, and support stops being a line you hope holds and becomes a tool that tells you precisely what you are risking and why.
Worth the read?


