
Stock Market Crashes — What They Are and Why They Happen
Stock market crashes are fast, broad drops in stock prices driven by leverage, crowding, and vanishing liquidity. Here is what they are and why they happen.
Stock market crashes are sudden, broad declines in stock prices, usually double-digit drops across major indexes like the S&P 500, the Dow Jones Industrial Average, or the Nasdaq, compressed into a single session or a few brutal days. They are not slow grinds lower. They are fast, disorderly, and driven by forced selling once confidence breaks. Understanding why they happen matters more than memorizing the dates they happened on.
Most coverage of stock market crashes treats them as freak accidents. They are not. A crash is what positioning looks like when too many participants are leaning the same way and liquidity disappears at the same moment they all reach for the exit. The trigger varies. The mechanics rarely do.
What a stock market crash actually means
A crash is a violent repricing. Price does not drift to a new level; it gaps, accelerates, and overshoots because sellers have to transact and buyers step back. The technical definition most desks use is a drop of roughly 10% or more in a major index over a very short window, but the percentage matters less than the behavior. In a crash, normal two-way trading stops. Order flow becomes one-directional, spreads widen, and the depth that looked reliable an hour earlier is gone.
That last part is the piece retail explanations skip. Liquidity drives markets more than opinions do. On a calm day, you can sell size into a quiet tape and barely move price. During a crash, the same order moves price several percent because the resting bids that normally absorb it have been pulled. The decline feeds on itself: lower prices trigger margin calls and stop-losses, those force more selling, and the selling pushes prices lower still. The crash is the feedback loop, not the headline that started it.
What causes stock market crashes
There is rarely one cause. A crash needs two ingredients: a market that is stretched and a shock that breaks confidence. The stretch builds quietly over months or years through some combination of overvaluation, excessive leverage, and crowded positioning. The shock can be almost anything, because by the time the market is fragile, the specific trigger is close to interchangeable.
The recurring drivers are consistent across history:
Leverage and margin. Borrowed money amplifies the move in both directions. When prices fall, leveraged positions get liquidated whether the holder wants to sell or not, which is why crashes accelerate rather than ease.
Overvaluation and speculation. When prices have detached from earnings and the marginal buyer is buying only because price is rising, the bid is hollow. It vanishes the moment momentum turns.
A confidence shock. An economic surprise, a credit event, a policy mistake, or a sudden risk like a pandemic removes the assumption that someone will buy the dip.
Forced and automated selling. Margin calls, risk-control mandates, and program selling convert a decline into a cascade. In 1987, portfolio insurance did exactly this.
Notice what is not on that list: a single villain. Crashes are structural. The conditions accumulate, and the trigger is just the pin.
A short history of stock market crashes
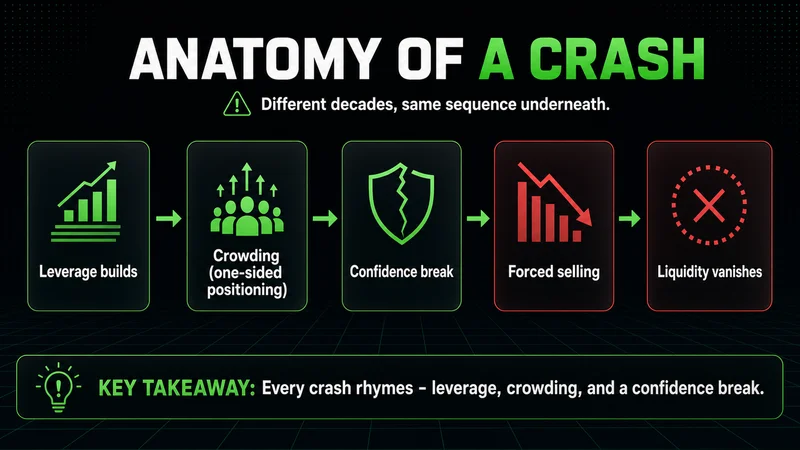
The examples rhyme. Different decades, different headlines, the same anatomy of leverage, crowding, and a confidence break.
1929. Speculation funded by margin inflated prices through the 1920s. When it broke, the Dow eventually fell roughly 89% from its peak and took about 25 years to reclaim the prior high. It opened the Great Depression.
1987 (Black Monday). The Dow fell about 22% in a single day, the worst one-day percentage decline on record. No single news item explains it; computer-driven portfolio insurance turned an ordinary pullback into a cascade.
2000 to 2002 (dot-com). Internet valuations detached from any earnings basis. When sentiment reversed, the Nasdaq lost about 78% from its peak over roughly two years.
2008. Subprime mortgage losses moved through leveraged balance sheets into the banking system. The S&P 500 fell close to 57% from its 2007 peak to the March 2009 low.
2020 (COVID-19). The fastest crash on record, with major indexes falling more than 30% in about a month, then recovering far faster than any prior episode.
The pattern across every example is the same: leverage and crowding set the stage, a shock lights the fuse, and forced selling does the damage. The recovery times are the part that varies most, and they vary enormously, from five months in 2020 to 25 years after 1929.
Stock market crashes versus bear markets
These terms get used interchangeably, and that costs people clarity. A crash is about speed. A bear market is about depth and duration. They overlap, but they are not the same event.
A crash is the violent move, typically a double-digit drop measured in days. A bear market is the regime that follows a peak, conventionally a decline of 20% or more from the high, measured over weeks, months, or years. A crash can begin a bear market, as in 2008, or it can resolve quickly and never become one, as in 2020 outside the very fast bear that accompanied it. A correction is the milder cousin: a decline of roughly 10% to 20% that does not reach bear-market depth.
The distinction is practical, not academic. A crash is a liquidity and execution problem you survive over hours and days. A bear market is a positioning and patience problem you manage over months. Confusing the two leads people to trade a multi-month regime with the urgency of a single bad session, or to treat a one-day flush as the start of a depression. The timescale tells you which problem you actually have.
What stock market crashes mean for investors and risk
For a long-term investor, a crash is a drawdown to be survived, not a signal to act on emotionally. History is consistent on one point: broad markets have eventually recovered every crash, though the wait has ranged from months to decades. The people who were hurt permanently were generally the ones who were overleveraged, forced to sell at the lows, or holding concentrated positions that did not come back.
This is where the practitioner view diverges from the standard investor article. At the execution level, a crash is not primarily a valuation story. It is a liquidity and sizing story. Volatility expands, ranges that held for weeks break in minutes, and the cost of being wrong rises sharply because slippage widens exactly when you most need to transact. Most traders are overleveraged without realizing it; a crash is when that hidden leverage gets revealed all at once. If a single position dictates your decisions during a volatile session, the size was too large before the crash ever started.
The honest qualifier matters here. The idea that crashes always recover holds for broad, diversified indexes, and it has held across U.S. history. It does not hold for individual names, and it does not hold on any timeline you can count on. An investor who needs the money in 18 months and a position trader managing overnight risk are facing different problems, and a framework built for one inverts for the other. Recovery is a statement about the index over a long horizon, not a promise about your specific holdings or your specific deadline.
What traders should know about stock market crashes
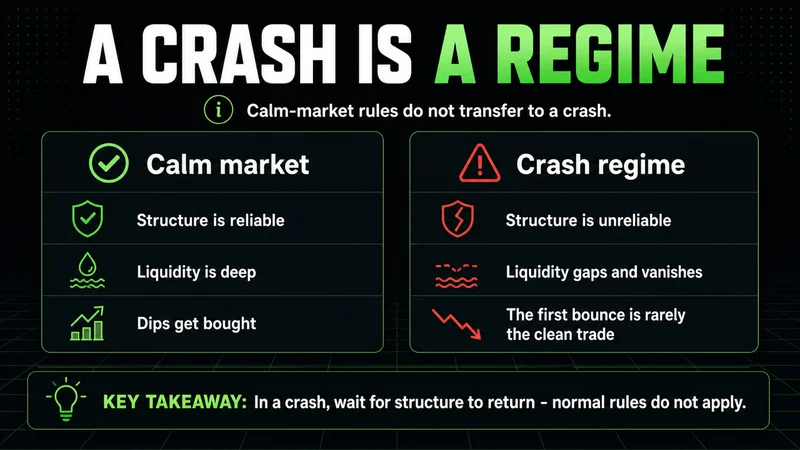
A crash is a regime, and the rules that work in calm conditions do not transfer to it. The first move after a major shock is usually not the cleanest opportunity. Volatility spikes pull in emotional participants on both sides, structure is unreliable while forced selling runs, and the tape only becomes readable again once that pressure clears.
A short, honest checklist holds up better than any prediction:
Cut size before volatility forces the decision for you. Risk that felt fine on a calm day is too large when ranges triple.
Define invalidation in advance and respect it. In a crash, the move against you arrives faster than your reaction time.
Treat liquidity as the real constraint. If you cannot exit cleanly, you do not actually have the position you think you have.
Wait for structure to re-form before pressing. Reacting to the first volatility spike is how most accounts give back capital during these sessions.
Protect capital first. Surviving the regime intact is what lets you participate in the recovery; chasing the bottom rarely does.
None of this requires predicting the crash. It requires being positioned so that a crash is survivable rather than fatal. The traders who come through these periods are not the ones who called the top. They are the ones who were not overexposed when it arrived.
FAQs
What is a stock market crash in simple terms? It is a sudden, sharp drop in stock prices across a major index, usually 10% or more compressed into a single session or a few days. It is defined by speed and disorder, where normal two-way trading breaks down and selling feeds on itself.
What is the difference between a stock market crash and a bear market? A crash is about speed: a violent double-digit drop measured in days. A bear market is about depth and duration: a decline of 20% or more from a peak, measured over weeks to years. A crash can start a bear market or resolve without becoming one.
What causes stock market crashes? They need a stretched market and a confidence shock. The stretch comes from leverage, overvaluation, and crowded positioning built up over time; the shock breaks confidence, and forced selling from margin calls and automated programs turns the decline into a cascade.
Do stock market crashes always recover? Broad, diversified indexes have recovered every crash in U.S. history, but the wait has ranged from about five months in 2020 to roughly 25 years after 1929. That recovery applies to the index over a long horizon, not to individual stocks or to any fixed deadline you might have.
Worth the read?


