
Supply and Demand Relationship — How Price Moves
The supply and demand relationship sets stock prices every day: how buyer and seller imbalance moves price, and where the framework quietly breaks down.

The supply and demand relationship is the balance between how many shares people want to buy and how many they want to sell at a given price. When buyers outweigh sellers, price rises until enough sellers appear. When sellers outweigh buyers, price falls until enough buyers step in. Every candle on a chart is that balance resolving in real time.
Most explanations stop at the textbook curves and leave you there. That is where the trouble starts. The curve tells you the logic, but it does not tell you how the imbalance actually reaches the tape, why price can move with no obvious news, or where the whole framework quietly stops working. This piece covers the relationship the way it behaves in a live market, not the way it looks in a diagram.
What the supply and demand relationship means
Strip away the jargon and the supply and demand relationship meaning is simple. Supply is the volume of shares offered for sale across a range of prices. Demand is the volume buyers are willing to absorb across that same range. Price is the single number where those two intentions meet at this moment.
The relationship is dynamic, not fixed. A company has not changed when its stock moves 3% in an hour, yet the price changed because the willingness to buy and sell shifted. That distinction matters. You are not watching value change tick by tick. You are watching positioning change.
Two forces govern the relationship:
The law of demand: as price rises, the quantity buyers want generally falls, and as price drops, demand tends to rise.
The law of supply: as price rises, the quantity sellers want to offer generally increases, and as price falls, supply tends to dry up.
These pull against each other. The point where they settle is the price you see quoted. The point where they would settle if both sides stopped moving is the equilibrium, and the market almost never sits there for long.
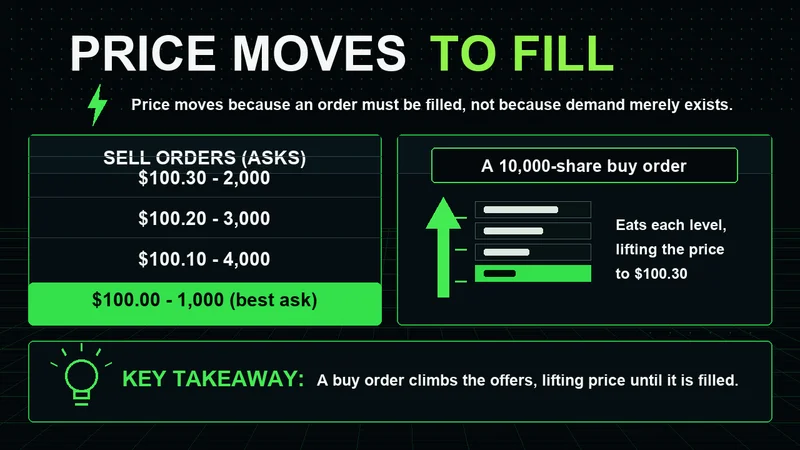
How the supply and demand relationship moves stock prices
Here is the part the curves underexplain. Price does not move because demand exists. It moves because demand has to be filled. A buyer who wants 10,000 shares cannot quietly wish them into the account. The order has to find sellers, and if there are not enough sellers at the current price, the buyer pays up to the next level to get filled. That paying up is the move.
The supply and demand relationship market impact works through this mechanic:
Demand exceeds supply at the current price, so buyers lift offers and price climbs to find resting sellers.
Supply exceeds demand, so sellers hit bids and price drops to find resting buyers.
The two roughly balance, so price churns in a range while both sides get filled near the same level.
This is why the supply and demand relationship stock market effect can look violent on thin volume and muted on heavy volume. A small imbalance against a thin book moves price far. A large imbalance against a deep book barely registers. The size of the move depends as much on what is resting on the other side as on the size of the order itself.
I will say this plainly, because it is the one opinion this article carries. Liquidity drives markets more than opinions do. A trader can be completely right about a company and still watch price run the other way for days, because the flow on the other side of the book is larger than the conviction. The headline rarely moves price by itself. The positioning around the headline does.
How the supply and demand relationship works on the tape
Curves are an abstraction. The actual relationship lives in the order book and the time and sales. This is the angle most explainers skip, and it is the one that separates a textbook reader from someone who can use the idea.
On a live book, demand shows up as bids stacked below price and supply shows up as offers stacked above it. When a level holds and price refuses to break lower, you are watching demand absorb supply. When a level breaks and price slices through it, you are watching demand exhaust and supply take over. The chart pattern is just the residue of that exchange.
Order flow is the supply and demand relationship in motion:
Aggressive buying lifts the offer; aggressive selling hits the bid.
Absorption happens when a large resting order soaks up the aggression without price moving much.
Displacement happens when one side gives way and price expands quickly to the next zone of resting orders.
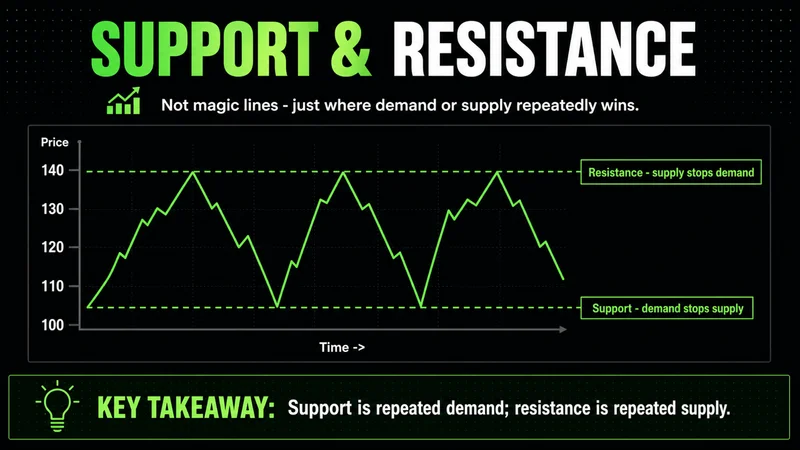
Read this way, support and resistance stop being magic lines. A support level is simply a price where demand has repeatedly been large enough to stop supply. A resistance level is a price where supply has repeatedly been large enough to stop demand. The level matters only as long as that resting interest is still there. Once it is consumed, the level means nothing, and price moves to the next pocket of liquidity.
How the supply and demand relationship compares to equilibrium price
The supply and demand relationship vs equilibrium price question confuses a lot of new traders, so it is worth being precise. The relationship is the ongoing tug between the two sides. The equilibrium price is the theoretical resting point where the quantity demanded equals the quantity supplied and there is no pressure to move.
In a textbook, the equilibrium is a clean intersection. In a real market, it is a moving target that price orbits rather than settles on. New information, new orders, and new positioning shift the curves constantly, so the equilibrium you would compute at 10:00 is not the one you would compute at 10:05.
The practical takeaway is that you should treat equilibrium as a center of gravity, not a destination. Price tends to revert toward fair value when an imbalance overextends, but it overshoots in both directions because order flow is emotional and lumpy near the turns. Chasing the exact equilibrium number is a trap. Reading whether price is being pulled toward it or pushed away from it is the useful skill.
A supply and demand relationship example for investors
Consider a company that reports earnings well above expectations after the close. The supply and demand relationship example for investors plays out like this. Before the report, buyers and sellers sat near balance and price drifted. The report changes how a large group values the stock, so demand jumps while many holders refuse to sell at yesterday's price. Supply at the old level vanishes.
The next morning, buyers must reach far higher to find sellers willing to part with shares. Price gaps up not because the company is now worth exactly that much, but because the willingness to sell has retreated faster than the willingness to buy. As price rises, two things happen: some early buyers take profit and add supply, and some buyers lose interest at the higher price as the law of demand predicts. Eventually the two sides find a new rough balance, and the stock settles into a fresh range.
That is the entire mechanism. A shift in willingness, an imbalance, a move to find the other side, and a new equilibrium. The numbers change with every stock, but the sequence does not.
Why the supply and demand relationship matters for investors
For a long-term investor, the supply and demand relationship for investors might sound like trader noise. It is not. It explains why a stock you consider cheap can stay cheap for months, and why a stock you consider expensive can keep climbing. Value sets a rough anchor over years. Supply and demand set the price every single day in between.
Why the supply and demand relationship matters for investors comes down to two practical edges:
Entry timing. Buying into heavy supply means paying up and often sitting through a drawdown. Buying when supply has been absorbed and demand is stepping in lowers your average cost.
Patience under pressure. Understanding that price reflects positioning, not a final verdict on value, makes it far easier to hold through volatility that has nothing to do with the underlying business.
The market rewards patience more than activity. Knowing that a sharp drop can be a liquidity event rather than a verdict keeps you from selling good positions into temporary supply.
Where the supply and demand relationship breaks down
Every framework has conditions where it stops working, and the supply and demand relationship limitations are real. This is the part worth memorizing, because acting on the model when it does not apply is how the model costs you money.
The relationship assumes a willing buyer meeting a willing seller, each responding to price. That assumption fails in several common cases:
Thin liquidity. In a low-float stock or an overnight session, a single order can move price several percent with no real shift in collective opinion. The print looks like a demand surge but it is just an empty book.
Forced and passive flows. Index rebalances, margin liquidations, and large fund redemptions move size regardless of price or value. The seller is not bearish and the buyer is not bullish. They are mechanical, and the model that assumes intent misreads them.
Gaps and halts. When price jumps a gap or reopens after a halt, there was no continuous auction between the two prices. The supply and demand relationship did not trade through that zone, so levels inside the gap carry little of the usual meaning.
This reads cleanly in liquid cash-hours trading where the book is deep and continuous. In thin overnight liquidity, on a halted name, or during a forced-flow event, the same chart structure means almost nothing. When you cannot identify who is buying and who is selling and why, the framework is no longer describing the market in front of you. Stand aside rather than force the read.
A supply and demand relationship checklist for market analysis
Use this when you want to judge whether the relationship is giving you a clean signal or noise. A supply and demand relationship checklist for market analysis keeps the read disciplined:
Is the move happening on real volume, or on a thin book that exaggerates small orders?
Is there a known forced flow, such as a rebalance or a liquidation, that explains the imbalance mechanically?
Are the relevant support and resistance levels still backed by resting interest, or has that interest already been consumed?
Is price being pulled back toward a prior equilibrium, or has it accepted a new range?
Does the order flow confirm the chart, with aggression on the side the structure suggests?
If most of these line up, the relationship is readable and you can act on it. If they do not, you are looking at noise dressed up as signal, and the disciplined move is to wait. This is how supply and demand relationship checklist work protects you from trading a clean-looking chart in a market that is anything but clean.
How traders use the supply and demand relationship in practice
How traders use supply and demand relationship comes down to locating imbalance before it fully resolves and defining risk against the level that would prove the read wrong. The common mistakes beginners make are predictable, so name them before they cost you.
Common supply and demand relationship mistakes beginners make are predictable enough to list:
Treating every old level as permanent, long after the resting interest behind it was consumed.
Ignoring volume entirely, so a thin-book spike gets read as real demand.
Entering against a known forced flow and assuming the move reflects opinion rather than mechanics.
Defining no invalidation, so a position turns into a hope trade the moment price disagrees.
The fix for each is the same. Confirm that resting interest still exists, weigh the move against the volume behind it, identify any mechanical flow distorting the print, and define where the idea is invalid before entering. None of this requires prediction. It requires reading what is in front of you and reacting to it with defined risk.
Trading without that context is gambling with better vocabulary. A level is only worth trading when structure, liquidity, and broader conditions agree. When they do not, the highest-quality decision is often no trade at all.
FAQs
What is the supply and demand relationship in simple terms? It is the balance between how many shares buyers want and how many sellers offer at a given price. When demand outweighs supply, price rises to find sellers; when supply outweighs demand, price falls to find buyers. The price you see is where those two intentions currently meet.
How does the supply and demand relationship affect stock prices? Price moves when an order has to be filled and the other side is not there at the current level. A buyer who cannot find enough sellers pays up to the next price, and that paying up is the move. The size of the move depends on how much resting interest sits on the other side of the book.
What is the difference between the supply and demand relationship and the equilibrium price? The relationship is the ongoing tug between buyers and sellers, while the equilibrium price is the theoretical point where the two would balance with no pressure to move. In a live market, price orbits equilibrium rather than settling on it, because new orders and information shift the balance constantly.
Worth the read?


