
Purchasing Managers Index — What Traders Read in It
The purchasing managers index scores business activity around 50. Here is what the print actually measures, and how traders read it on release.
The purchasing managers index is a monthly survey number that tells you whether business activity grew or shrank, scored on a scale where 50 is the line between expansion and contraction. A reading above 50 means the sector expanded versus the prior month; below 50 means it contracted. That single threshold is the whole point, and it is also where most people stop thinking. The level matters less than the direction of travel and how far the print lands from what the market already expected.
The purchasing managers index is useful because it arrives early, before the hard economic data that confirms or contradicts it. That timeliness is its edge and its trap. You get a fast read on momentum, but you are reading sentiment from a sample of executives, not a count of finished output. Treat it as a directional signal that needs context, not a verdict.
What the purchasing managers index actually measures
The purchasing managers index meaning is straightforward once you strip away the jargon. Each month, survey firms ask a panel of senior purchasing managers at a few hundred companies a simple question for each part of their business: is it higher, lower, or unchanged versus last month. Those answers get rolled into a diffusion index, which is why 50 sits at the center. If exactly half report improvement and half report decline, the number is 50.
The most-watched versions are the manufacturing PMI and the services PMI, and they often disagree. Manufacturing turns first because factories sit at the front of the supply chain, while services track domestic demand and tend to lag. When the two diverge, the spread between them usually says more than either number alone. A manufacturing print sliding under 50 while services holds above it describes an economy cooling at the edges but not at the core.
Different providers publish their own series, and they are not interchangeable. The headline U.S. manufacturing figure most traders quote comes from the Institute for Supply Management, while S&P Global runs parallel surveys across dozens of countries. Knowing which series moved is part of reading the print correctly, because a soft ISM number and a firm S&P Global number describe slightly different slices of the same economy.
How the purchasing managers index is calculated
The purchasing managers index calculation weights five components, and the weighting is the part most explanations skip. The headline manufacturing number is built from new orders, production, employment, supplier deliveries, and inventories. New orders and production carry the most weight because they lead; inventories carry the least because they lag. So how is the purchasing managers index calculated in practice? Each component gets its own diffusion score, then the five are combined into the headline figure using those fixed weights.
For each component, the survey takes the percentage reporting an increase, adds half the percentage reporting no change, and produces a number between 0 and 100. The half-weight on no change is what anchors the index at 50 when responses are balanced. This is also why the purchasing managers index report rewards close reading: the headline can hold steady while the internals shift, and the internals are where the next move usually shows up first.
The component most worth watching is new orders, because demand precedes output. A headline that ticks down while new orders tick up is a different story than a headline that holds while new orders collapse. The first hints at a near-term bottom. The second warns that the headline has not caught up to the deterioration underneath it yet.
Why the purchasing managers index matters as an economic indicator
The purchasing managers index economic indicator role rests on three properties: it is timely, it is not revised after release, and it correlates with broader activity well enough to act as a leading signal. Most hard data gets revised for months. The PMI does not. What prints is what stands, which makes it cleaner to model against than figures that get quietly rewritten later.
This is exactly why purchasing managers index matters for investors who care about turning points. A series of prints crossing 50 from below, with new orders leading, tends to precede a broader pickup in activity and earnings. The reverse holds on the way down. The index will not time a top or bottom for you, but it will tell you which side of the cycle you are standing on, and that context shapes how aggressive any single position should be.
There is a quieter reason it matters. Central banks read it. When policymakers cite cooling business activity, they are often pointing at exactly this kind of survey. A print that shifts the rate-cut conversation moves far more than the manufacturing sector it measures, because the market is repricing policy, not factories.
How the purchasing managers index affects the stock market
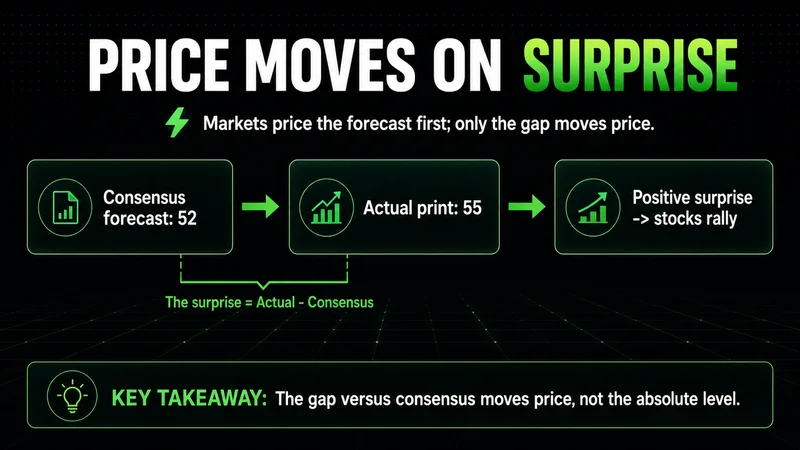
The purchasing managers index impact on stocks runs through expectations, not through the absolute number. The market has already priced a forecast before the release. What moves price is the surprise: the gap between the print and the consensus. A 49.5 that beats a feared 47 can rally risk assets, while a 51 that misses a hoped-for 53 can sell them off. The level expanded or contracted; the reaction depends entirely on what was already discounted.
The component reaction is the second layer. A headline beat carried by employment and new orders reads as durable. A beat carried by supplier deliveries can be misleading, because slower deliveries inflate the index but often signal supply stress rather than healthy demand. Markets that parse this distinction in real time tend to fade the headline and trade the internals.
Here is where the purchasing managers index trading signal earns its qualifier. The index moves equities most when the rate-policy lens is active. In a regime where the central bank is on hold and inattentive to growth data, a soft print can pass with almost no reaction; the same number during an active easing or hiking debate can swing index futures hard. The signal is conditional on what the market is currently obsessing over, and that obsession rotates.
How traders use purchasing managers index data on release
The top guides explain the number well and then stop at the door of the trading room. This is the part they leave out. The print is not the trade. How traders use purchasing managers index data has more to do with the second move than the first.
The initial spike on release is liquidity reacting to the surprise, and it is frequently the worst entry of the session. The cleaner read comes after that first impulse, when price either holds the new level with acceptance or rejects it and reverts. The best traders react well to that follow-through; they do not predict the headline in advance. Most accounts that get hurt on data days were positioned for a number they could not see, then forced to manage a position they should never have held into the release.
A disciplined release routine looks like this:
Note the consensus and the prior print before the release, so you know what counts as a surprise.
Let the first impulse run without chasing it; the initial candle is rarely the trade.
Watch whether price accepts or rejects the post-release level, and check the component detail, not just the headline.
Define invalidation before entering, and size for the volatility the print just created, not the volatility before it.
This routine is reactive by design. The PMI is a context input, not an entry trigger. It tells you which way the macro wind is blowing so your structural read has a backdrop, and it keeps you from fighting a print the whole market is leaning into.
When the purchasing managers index misleads you
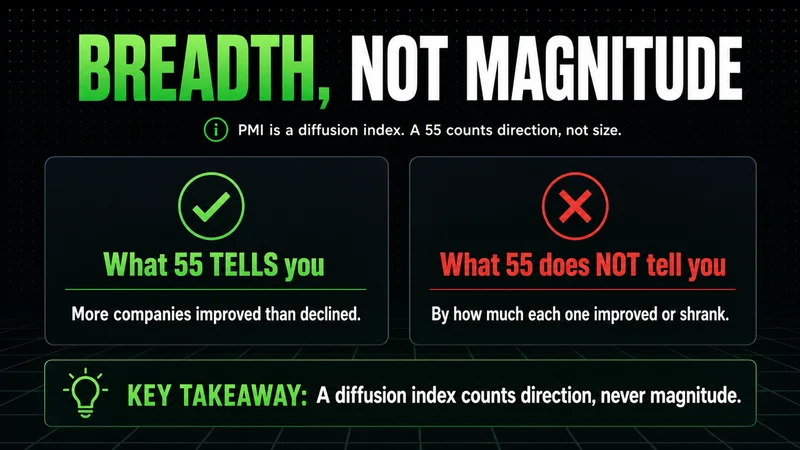
The purchasing managers index limitations are real, and ignoring them is how the signal becomes noise. It is a diffusion index, so it measures breadth, not magnitude. A reading of 55 tells you more companies improved than declined; it does not tell you by how much. An economy where a few firms surge while most stagnate can print the same number as one where everyone improves modestly. The headline cannot distinguish those two worlds.
It is also sentiment. The panel reports perception, and perception can lead or lag the hard data in either direction. There are stretches where survey optimism runs well ahead of actual output, and stretches where it stays gloomy while real activity recovers. When the soft survey data and the hard data disagree, the gap itself is the information, and resolving it usually takes weeks.
For a trader, the cleanest way to state the limit is this: the signal works while the market is treating growth as the dominant story. The moment the dominant story rotates to inflation, liquidity, or a geopolitical shock, the same print that moved index futures last month can land with no reaction at all. The framework does not break loudly. It just quietly stops paying, and the only tell is that price ignores a number it would have respected a month earlier.
Purchasing managers index versus the consumer price index
The purchasing managers index vs consumer price index comparison comes up constantly, and the two answer different questions. The PMI is a forward-looking survey of business activity scored around 50. The consumer price index is a backward-looking measurement of how much prices actually rose, reported as a percentage change. One samples sentiment about momentum; the other counts realized inflation.
Here is the purchasing managers index vs consumer price index explained in trading terms. The PMI tells you whether the economy is speeding up or slowing down. CPI tells you what that activity is doing to prices, which in turn shapes what the central bank is likely to do about rates. In a rate-driven market the two interact: a strong PMI alongside hot CPI argues for tighter policy, while a weak PMI alongside cooling CPI argues for easing. Read together they sketch the policy path. Read in isolation, either one can point you the wrong way.
FAQs
What is the purchasing managers index? It is a monthly survey-based number that measures whether business activity in manufacturing or services expanded or contracted versus the prior month. It is scored on a 0 to 100 scale where 50 separates expansion from contraction, and it is one of the earliest reads on economic momentum.
What does a high purchasing managers index mean? A high reading, comfortably above 50, means a majority of surveyed companies reported improving conditions, which signals expansion. It does not measure how strong that expansion is, only how broad it is across the panel. A high print matters most when it beats what the market already expected.
How is the purchasing managers index calculated? Each of five components — new orders, production, employment, supplier deliveries, and inventories — gets a diffusion score from the percentage reporting an increase plus half the percentage reporting no change. The five scores are combined using fixed weights, with new orders and production weighted most heavily, to produce the headline number.
Why does the purchasing managers index matter for investors? It is timely and never revised, so it gives a clean early read on whether the economy is accelerating or slowing. Investors use it to gauge which side of the business cycle they are on and to anticipate how central banks might adjust rates, which moves markets more than the survey itself.
How does the purchasing managers index affect the stock market? Markets react to the surprise versus consensus, not the absolute level. A print that beats expectations can lift equities even if it shows contraction, and a print that misses can sell them off even above 50. The reaction is largest when interest-rate policy is the market's dominant focus.
What are common mistakes when reading the purchasing managers index? Treating the level as the whole story, ignoring the component detail, and forgetting it is a breadth-based sentiment survey rather than a magnitude measure. The other frequent error is trading the first spike on release instead of waiting to see whether price accepts or rejects the new level.
Worth the read?


