
Working Capital Turnover Ratio — What It Tells You
The working capital turnover ratio shows how many dollars of sales each dollar of working capital supports, and how to read it without being misled.
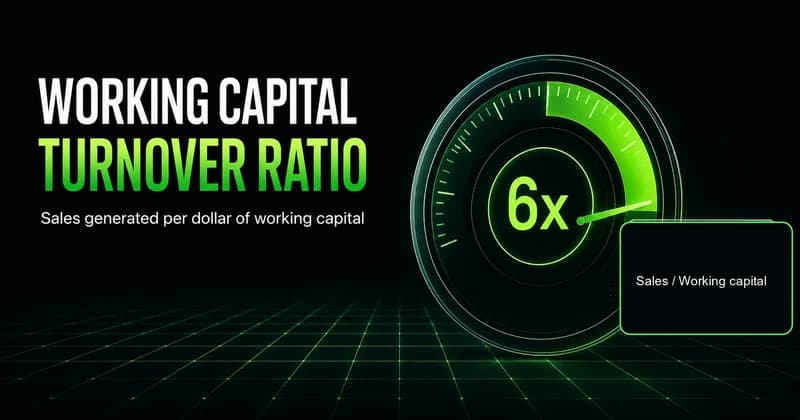
The working capital turnover ratio measures how many dollars of sales a company generates for every dollar of working capital it ties up. Divide net sales by average working capital, and a result of 6 means each dollar of short-term capital is supporting six dollars of revenue. It is an efficiency signal, not a verdict, and reading it well means knowing when a high number reflects discipline and when it reflects a thin cushion that breaks under stress.
Most explainers stop at the formula and a verdict that higher is better. That framing skips the part that matters when you are looking at a real balance sheet. The same number can describe a company running a tight, well-managed operation or a company one slow quarter away from a liquidity problem. Context decides which one you are holding.
What is the working capital turnover ratio?
The working capital turnover ratio shows how efficiently a business converts its working capital into sales. Working capital is current assets minus current liabilities — the short-term money a company has available to fund day-to-day operations. The ratio asks a direct question: for every dollar locked up in that operating cushion, how much revenue does the company produce?
That is the full meaning of the metric. A higher ratio suggests the company is squeezing more sales out of less tied-up capital. A lower ratio suggests capital is sitting idle in inventory or receivables instead of generating revenue. The number itself is neutral. The interpretation depends on the industry, the business model, and the quality of the balance sheet underneath it.
The working capital turnover ratio formula and a worked example
The working capital turnover ratio formula is straightforward:
Working Capital Turnover Ratio = Net Sales / Average Working Capital
Net sales is revenue after returns and allowances. Average working capital is the working capital at the start of the period plus the working capital at the end, divided by two. Using the average rather than a single point smooths out the seasonal swings that distort a snapshot reading.
The calculation runs in three steps. First, find current assets minus current liabilities at the beginning and end of the period. Second, average the two. Third, divide net sales by that average. Here is a worked example for a company we will call Northbridge Supply.
| Line item | Amount |
|---|---|
| Net sales | $12,000,000 |
| Current assets (beginning) | $3,000,000 |
| Current liabilities (beginning) | $1,200,000 |
| Current assets (ending) | $3,400,000 |
| Current liabilities (ending) | $1,400,000 |
| Working capital (beginning) | $1,800,000 |
| Working capital (ending) | $2,000,000 |
| Average working capital | $1,900,000 |
Divide net sales of $12,000,000 by average working capital of $1,900,000, and the working capital turnover ratio is roughly 6.3. Northbridge generates about $6.30 in sales for every dollar of working capital. Whether that is good is the next question, and it has no universal answer.
How to interpret the working capital turnover ratio
Interpretation starts with comparison, not with an absolute number. A working capital turnover ratio is only meaningful against the company's own history and against direct competitors in the same industry. A grocery distributor and a software firm operate on entirely different capital structures, so comparing their ratios tells you nothing.
Within those guardrails, the readings break down roughly like this:
- A rising ratio over several periods usually signals improving efficiency — the company is funding more sales without adding proportional working capital.
- A falling ratio often points to capital getting trapped in slow-moving inventory or aging receivables.
- A very high ratio can mean efficiency, or it can mean the company is operating on a dangerously thin working-capital cushion that leaves no room for a demand shock.
That last point is where most beginners go wrong. They treat a high number as an unambiguous positive. It is not. A ratio that climbs because sales grew is healthy. A ratio that climbs because the company drained its current assets to the bone is fragile. The formula cannot tell those two apart — you have to read the balance sheet to know which story you are looking at.
How investors read the ratio when screening a stock
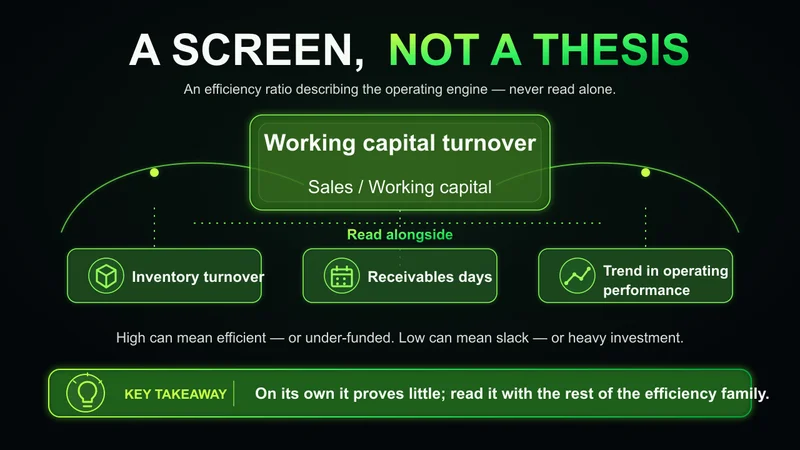
For an investor, the working capital turnover ratio is a screening tool, not a thesis. It belongs to a family of efficiency ratios that describe how well management runs the operating engine. On its own it proves little. Read alongside inventory turnover, receivables days, and the trend in operating cash flow, it starts to mean something.
The signal investors actually want is the direction of travel. A company whose ratio improves steadily while revenue grows is converting capital into sales more efficiently each year, which is the kind of operational discipline that compounds. A company whose ratio jumps in a single period deserves scrutiny, because the cause matters more than the move. Did sales accelerate, or did the company just let payables stretch and inventory thin out?
This is where the metric connects to a broader principle. Process consistency tells you more than a single strong reading. A balance sheet that shows steady, explainable efficiency across cycles is worth more than one that posts a spectacular ratio for a quarter and cannot say why. The number is a starting point for questions, not an answer.
When the working capital turnover ratio misleads you
The ratio breaks down in a few specific conditions, and knowing them keeps you from drawing the wrong conclusion.
The clearest failure is negative working capital. Some businesses — large retailers and subscription companies, for example — collect cash from customers before they pay suppliers. Their current liabilities exceed their current assets by design, which produces a negative denominator and a ratio that is mathematically meaningless. A negative working capital turnover ratio is not a red flag in those models; it reflects a funding advantage. Applying the standard interpretation there would point you exactly the wrong way.
Seasonality is the second trap. A retailer measured right after the holiday season looks completely different from the same retailer measured in a slow quarter. This is why the average working capital matters, and why a single-period snapshot can mislead badly. The ratio reads cleanly across a full annual cycle; pulled from one quarter in isolation, the same figure can mean almost nothing.
The third condition is a high ratio driven by shrinking capital rather than growing sales. A company starved of working capital will post an impressive turnover number right up until it cannot fund a normal operating swing. Efficiency and fragility look identical in this one figure. You only separate them by checking whether the ratio rose because the numerator grew or because the denominator collapsed.
Working capital turnover ratio vs current ratio
These two ratios get confused because both use current assets and current liabilities, but they answer different questions. The working capital turnover ratio is an efficiency measure: how much revenue the operating cushion generates. The current ratio is a liquidity measure: current assets divided by current liabilities, describing whether the company can cover its short-term obligations.
A company can score well on one and poorly on the other. A high working capital turnover ratio paired with a current ratio near 1 describes a business running lean and efficiently but with little margin for error. A low turnover ratio paired with a high current ratio describes a business sitting on idle capital it is not deploying. Read together, they sketch both the efficiency and the resilience of the same balance sheet. Read in isolation, either one is easy to misjudge.
Common working capital turnover ratio mistakes beginners make
A few errors show up repeatedly when people first start using this ratio:
- Reading the number in isolation, without an industry benchmark or the company's own trend for context.
- Treating a high ratio as automatically good, ignoring whether it came from strong sales or a drained balance sheet.
- Using a single-period snapshot instead of average working capital, which exaggerates seasonal distortion.
- Applying the standard interpretation to a negative-working-capital business, where the formula does not behave normally.
The limitations of the working capital turnover ratio all trace back to the same root. It is a single ratio built from two summary numbers, and it cannot describe the quality of what sits inside them. It is a useful first filter and a poor final word.
FAQs
What is a good working capital turnover ratio? There is no universal number, because every industry carries different capital requirements. Compare the ratio to direct competitors and to the company's own multi-year trend. A figure that is rising on the back of growing sales is the healthy signal, regardless of the absolute level.
How do you calculate the working capital turnover ratio? Divide net sales by average working capital. Average working capital is the beginning balance plus the ending balance, divided by two, where working capital itself is current assets minus current liabilities.
Can the working capital turnover ratio be negative? Yes, when current liabilities exceed current assets and working capital is negative. For businesses that collect from customers before paying suppliers, this reflects a funding advantage rather than a problem, so the standard interpretation does not apply.
What does the working capital turnover ratio tell investors? It signals how efficiently management converts short-term capital into sales, and the trend matters more than the level. Read alongside inventory turnover, receivables days, and operating cash flow, it helps separate operational discipline from a balance sheet that only looks efficient.
Worth the read?


