
GAAP Analysis — How to Read a Company's Real Numbers
GAAP analysis is reading a company's financial statements under standardized rules to judge real profitability, cash, and risk. Here is how to do it.
GAAP analysis is the practice of reading a company's financial statements through the lens of Generally Accepted Accounting Principles, the standardized rules U.S. public companies use to record and report their numbers. The point is simple: when every company follows the same accounting language, you can compare one stock against another and against its own history without guessing what the figures mean. That comparability is the whole reason GAAP analysis matters to anyone deciding where capital goes.
Most people treat GAAP as an accountant's concern, something that happens before the numbers reach an investor. That framing is backward. The principles are not background detail. They are the rules that decide what a reported profit actually represents, and reading them well is closer to risk management than to bookkeeping. A figure you do not understand is a position you cannot size correctly.
What GAAP analysis means and why it exists
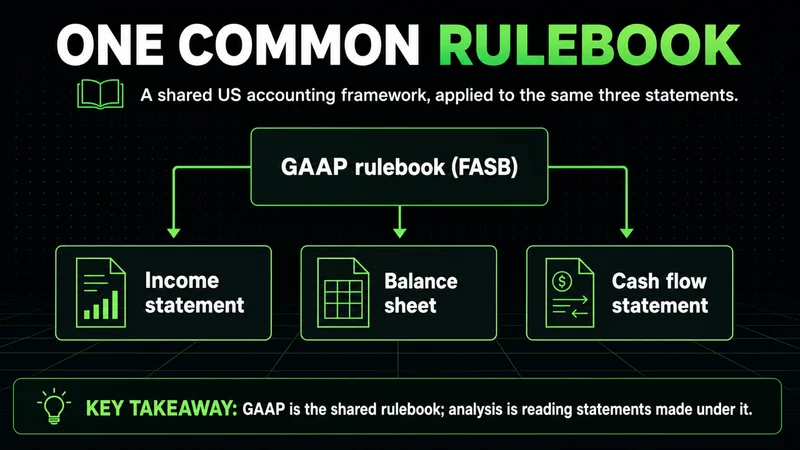
GAAP is a common framework of accounting standards, conventions, and disclosure rules maintained in the United States by the Financial Accounting Standards Board. GAAP analysis is what you do with statements prepared under that framework. You read the income statement, the balance sheet, and the cash flow statement as a connected system, and you judge profitability, liquidity, leverage, and the quality of the earnings behind the headline number.
The framework exists to remove ambiguity. Before standardized reporting, two companies could describe the same transaction in two different ways, and an outsider had no reliable basis for comparison. GAAP forces consistency. Revenue gets recognized on defined terms, costs get matched to the periods they helped produce, and assets get carried on rules everyone can read. The result is a level field where the numbers carry the same meaning across companies and across time.
That consistency is also the reason GAAP can mislead a careless reader. The rules are uniform, but they still leave room for judgment, and management makes those judgments. Two companies can both follow GAAP and still report very different pictures of the same underlying business, depending on the estimates and timing choices they make within the rules. Understanding where that discretion lives is most of the work.
The components of GAAP financial statements
GAAP analysis rests on a small set of documents, and each answers a different question. Reading them in isolation is where most beginners go wrong. They are designed to be cross-checked against one another.
- Income statement. Revenue, costs, and the profit left over for a period. It tells you whether the business made money, but only on an accrual basis, which is not the same as cash.
- Balance sheet. A snapshot of assets, liabilities, and equity at one moment. It tells you what the company owns, what it owes, and what is left for shareholders.
- Statement of cash flows. Cash moving through operating, investing, and financing activities. It tells you whether the reported profit turned into real money.
- Statement of changes in equity. How the ownership stake moved over the period through earnings, dividends, and share activity.
The accompanying notes are not optional reading. The disclosures behind the statements explain the accounting choices, the estimates, and the obligations that the headline figures compress into a single line. A practitioner spends as much time in the notes as in the statements themselves, because that is where the judgment calls are documented.
The core principles tie these documents together. Accrual accounting records revenue when it is earned and costs when they are incurred, not when cash changes hands. The matching principle pairs costs with the revenue they generated. Historical cost carries many assets at what was paid, not at current market value. Full disclosure requires that anything material to a reader's understanding appears somewhere in the filing. Each principle shapes what a number means, and each one is a place where two honest companies can land in different spots.
Consider revenue recognition, which sits at the center of most GAAP analysis. Under the standard, a company records revenue when it satisfies a performance obligation, which can be a single moment or a stretch of time. A software firm selling a multi-year contract does not book the whole contract at signing; it recognizes the revenue over the life of the obligation. Two companies with identical bookings can therefore report very different revenue in the same quarter depending on contract structure and timing. Reading GAAP statements means knowing that the revenue line is the output of a policy, not a raw count of cash received.
The same is true of how costs land on the income statement. Depreciation spreads the cost of a long-lived asset across the years it is expected to serve, and the schedule a company chooses changes reported profit without changing a single dollar of cash spent. Inventory accounting works the same way; the method used to value what sits on the shelf flows straight into the cost of goods sold and out the other side as margin. None of this is manipulation. It is the discretion the framework grants, and it is precisely the discretion a careful reader has to account for before comparing one company against another.
How to read GAAP analysis step by step
There is no single GAAP formula that outputs a verdict. The work is sequential, and the order matters because each statement provides context for the next.
Start with the income statement to see whether the business is profitable and how that profit is built. Look at revenue, gross margin, operating margin, and net income, then compare them against prior periods rather than reading one quarter in isolation. A single period tells you almost nothing; a trend tells you whether the business is improving, decaying, or holding.
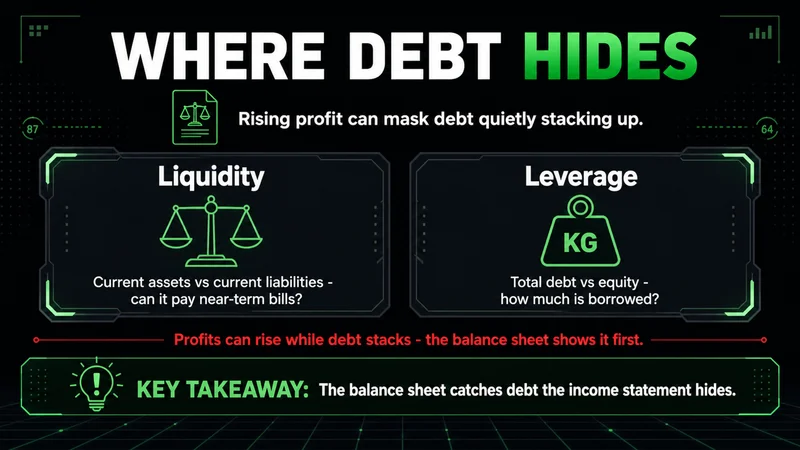
Move to the balance sheet to judge financial position. Compare current assets against current liabilities for liquidity, and weigh total debt against equity for leverage. A company can post rising profits while quietly stacking debt, and the balance sheet is where that shows up before it becomes a problem.
Then go to the cash flow statement, which is the one most beginners skip and the one that matters most. Reported net income is an accrual figure shaped by estimates. Operating cash flow is harder to dress up. When a company reports strong earnings but weak or negative operating cash flow, that gap is the first thing worth interrogating. Profit on paper that never becomes cash is a warning, not a footnote.
Finish by reading the notes and reconciling the three statements against each other. The numbers should agree. Where they diverge, the divergence is the signal. This is the part of GAAP analysis that separates reading statements from understanding a business.
The interpretation step is where ratios earn their place, used as comparisons rather than verdicts. Gross and operating margins tell you how much of each dollar of revenue survives the cost structure, and their direction over several years matters more than any single value. The current ratio and quick ratio measure whether short-term obligations are covered by short-term assets. Debt-to-equity frames how much of the business is financed by lenders rather than owners. Return on equity ties profit back to the capital that produced it. No single ratio decides anything. Read together and across time, they describe whether a business is strengthening or quietly deteriorating, which is the only question GAAP analysis is built to answer.
The discipline that holds the whole process together is comparison. A margin of 20 percent means nothing in isolation; it means something against the same company three years ago and against a direct competitor reporting under the same rules. Trends beat snapshots, and peers beat absolutes. A reader who anchors every figure to a comparison is doing real GAAP analysis. A reader who reacts to a single number in a single quarter is guessing with extra steps.
What to look for in GAAP analysis: the red flags
GAAP compliance is a floor, not proof of health. A company can follow every rule and still present a strained picture, and the statements usually show the strain before the headlines do. These are the patterns worth treating as risk markers.
- Earnings without cash. Net income climbing while operating cash flow stalls or falls. This is the single most common tell that profit is being manufactured through timing and estimates rather than through the business.
- Receivables outrunning revenue. Accounts receivable growing faster than sales suggests revenue is being booked before the cash is collected, or that customers are struggling to pay.
- One-time items that recur. Charges labeled non-recurring that appear quarter after quarter. If it keeps happening, it is not one-time, and excluding it flatters the trend.
- Margin moves with no explanation. A sudden change in gross or operating margin that the notes do not account for deserves scrutiny before trust.
- Heavy reliance on adjusted figures. When management leans on its own non-GAAP numbers and buries the GAAP result, the gap between the two is the thing to examine, not ignore.
None of these is automatically fatal. Each is a question. The discipline is to treat the statements as a set of conditions that either confirm a thesis or invalidate it, the same way you would treat any other risk you take on. A red flag you can explain is context. A red flag you cannot explain is a reason to stay out.
The non-GAAP gap deserves its own attention, because it is the area the standard reporting cannot police. Companies are allowed to present adjusted figures alongside their GAAP results, and many do, stripping out items they argue do not reflect ongoing operations. Sometimes that is reasonable. Often it is a way to redirect attention from a weaker GAAP number toward a flattering one. The useful move is not to dismiss adjusted figures or accept them; it is to measure the distance between the two. A small, stable gap is usually benign. A wide gap that grows over time, built on add-backs that keep recurring, tells you the company would rather you read its version of the numbers than the standardized one. That preference is itself information.
GAAP analysis vs IFRS analysis explained
GAAP is the U.S. standard. Most of the rest of the world reports under International Financial Reporting Standards, and the difference matters whenever you compare a domestic company against a foreign one. The two frameworks share goals but diverge on specifics, and ignoring that divergence produces false comparisons.
| Dimension | GAAP | IFRS |
|---|---|---|
| Primary jurisdiction | United States | Over 140 countries |
| Rule style | Rules-based, more prescriptive | Principles-based, more interpretive |
| Inventory costing | LIFO permitted | LIFO not permitted |
| Asset revaluation | Generally carried at historical cost | Certain assets may be revalued upward |
| Standard setter | FASB | IASB |
The practical takeaway is narrow. When you compare a U.S. company reporting under GAAP against a European competitor reporting under IFRS, some line items are not directly comparable until you adjust for the framework difference. Inventory and asset values are the usual offenders. The comparison still works; it just requires knowing where the two languages disagree before you draw a conclusion.
Inventory is the clearest case. GAAP permits the last-in, first-out method, which can lower reported profit and taxes when prices are rising; IFRS bans it outright. Two otherwise identical companies, one on each framework, can report different costs of goods sold and different inventory values for the same physical stock. Asset treatment is the other common gap. IFRS allows certain assets to be revalued upward to fair value, while GAAP generally holds them at historical cost. A company reporting under IFRS can therefore show a stronger balance sheet for assets that a GAAP company carries at a lower book value, even when the underlying assets are identical.
The broader distinction is one of philosophy. GAAP is rules-based and prescriptive, spelling out specific treatments for specific situations. IFRS is principles-based and leans on professional judgment to apply broad standards. Neither is strictly better. The point for analysis is that the same economic event can produce different reported numbers under each, so a cross-framework comparison is only honest once you have adjusted for where the rules part ways.
A GAAP analysis example for investors
Consider a company that reports a record quarter: revenue up, net income up, the headline everyone wanted. On the income statement alone, the story is clean. GAAP analysis is what happens after that first impression.
Turn to the cash flow statement and you find operating cash flow declined while net income rose. On the balance sheet, accounts receivable jumped well ahead of the revenue increase. In the notes, a large share of the quarter's profit traces to a change in an accounting estimate rather than to the underlying operation. Each piece is GAAP-compliant. Together, they describe a business whose reported strength is not yet backed by cash.
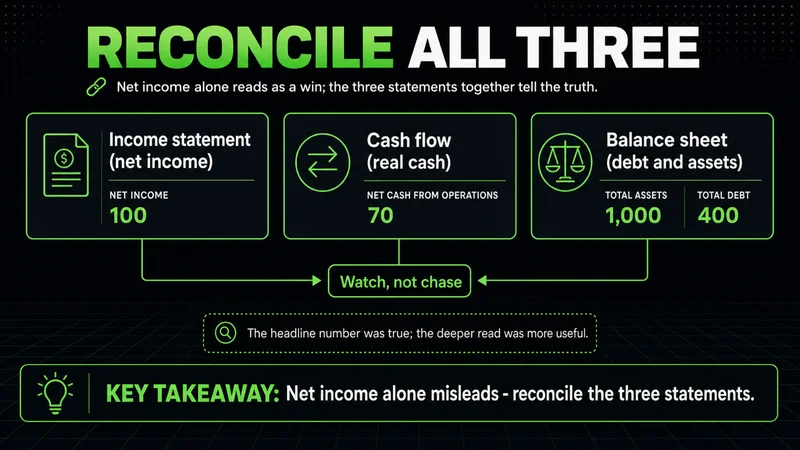
That is the entire value of the exercise. The headline number was true and the deeper read was more useful. An investor who stopped at net income would have priced the quarter as a win. An investor who reconciled the three statements would have seen a business to watch, not chase. Neither read breaks the rules. Only one reflects what the company actually earned.
This is also where GAAP analysis stops being enough on its own. The framework tells you what happened inside the reporting period under a defined set of conventions. It does not tell you what the market already knows, how the stock is positioned, or how sentiment is set going into the next print. A clean set of statements can sit under a stock that still falls, because price reflects expectations, not last quarter's accruals. Statement analysis defines the business; it does not define the trade. Treat it as one input into a position, sized against a defined risk, rather than as a signal to act on by itself.
A practical GAAP analysis checklist for beginners
The process is easier to hold in mind as a sequence than as a pile of ratios. This is the order an experienced reader tends to follow.
- Read three to five years of statements, never a single period in isolation.
- Start with the income statement and track margins as a trend.
- Check the balance sheet for liquidity and the direction of debt.
- Compare operating cash flow against net income and treat any gap as a question.
- Watch receivables and inventory against revenue for early stress.
- Read the notes for estimate changes, one-time items, and obligations the headlines hide.
- Reconcile the three statements; where they disagree, dig until you understand why.
Most blown accounts do not start with a bad chart. They start with a position taken on a number the trader never actually understood. Reading the statements is the cheapest risk control available.
None of this requires an accounting degree. It requires patience and the willingness to read past the headline figure, which is exactly the habit that separates a process-driven investor from someone reacting to the first number printed.
FAQs
What is GAAP analysis in simple terms? It is reading a company's financial statements under the Generally Accepted Accounting Principles framework to judge how profitable, liquid, and financially sound the business really is. Because every U.S. public company follows the same rules, GAAP analysis lets you compare one stock against another and against its own history on a consistent basis.
What are the main components of GAAP analysis? The income statement, the balance sheet, the statement of cash flows, and the statement of changes in equity, read together with the accompanying notes. Each answers a different question, and the notes explain the accounting judgments behind the headline figures.
How does GAAP analysis help with stock analysis? It tells you what a reported profit actually represents and whether that profit turned into cash. Reconciling the three statements exposes gaps, such as earnings rising while operating cash flow falls, that a single headline number hides. That deeper read informs how you size and risk a position rather than acting on the headline alone.
What are common GAAP analysis red flags? Net income rising while operating cash flow weakens, receivables growing faster than revenue, recurring charges labeled as one-time, unexplained margin swings, and heavy reliance on adjusted non-GAAP figures. None is automatically fatal, but each is a question worth answering before committing capital.
What is the difference between GAAP analysis and IFRS analysis? GAAP is the U.S. standard and is more rules-based, while IFRS is used across most of the world and is more principles-based. Specific items like inventory costing and asset revaluation differ between them, so comparing a GAAP company against an IFRS company requires adjusting for those differences first.
Where this fits in your process
GAAP analysis is the foundation under any decision based on what a company reports, not a standalone signal to act on. It defines the business by reading the statements as a connected system and treating the gaps between them as questions rather than noise. Pair it with an understanding of positioning and price, size every conclusion against defined risk, and it becomes one of the more reliable inputs you have. Read more on reading financial statements, separating GAAP from non-GAAP earnings, and building a repeatable fundamentals process across the rest of the fundamentals library.
Worth the read?


