
Market Value Ratios — What They Tell You About Price
Market value ratios measure what the market pays for a company against its earnings, book value, and sales. Here is how to read them without fooling yourself.

Market value ratios measure what the market is willing to pay for a company relative to its earnings, book value, sales, or dividends. They are price divided by a fundamental number, and they exist to answer one question: is this stock expensive or cheap against what the business actually produces? That is the whole job. A market value ratio is not a verdict, and it is not a signal to buy. It is context for a decision that still has to be made.
Most people treat these numbers as a scoreboard. A low price-to-earnings ratio reads as cheap, a high one reads as expensive, and the analysis stops there. That habit is where the trouble starts. The same ratio means different things in different sectors, different regimes, and different points of a cycle. Reading the number without reading the conditions around it is gambling with better vocabulary.
What market value ratios actually measure
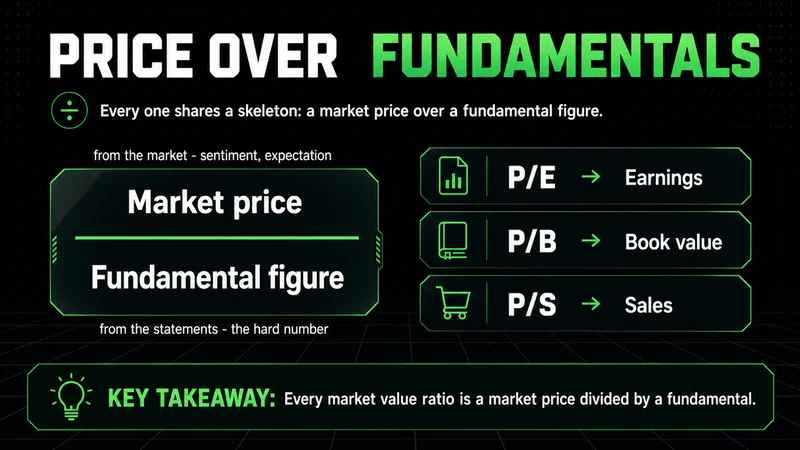
Every market value ratio shares the same skeleton: a market price on top, a fundamental figure on the bottom. The price comes from the market, which means it carries sentiment, positioning, and expectation. The denominator comes from the financial statements, which means it carries the reported reality of the business. The ratio sits between the two and shows the gap.
That structure is why these ratios are useful and why they mislead. When the market is optimistic, prices rise faster than earnings, and the ratios expand. When sentiment turns, prices fall first while the reported numbers lag, and the same ratios compress. The denominator updates on a quarterly schedule. The numerator updates every second the market is open.
The market value ratios formula set worth knowing
There is no single market value ratios formula. There is a small family of them, and each compares price to a different fundamental anchor. The ones that carry the most weight in practice:
- Price-to-earnings (P/E) — market price per share divided by earnings per share. The most cited ratio, and the most context-dependent.
- Price-to-book (P/B) — market price per share divided by book value per share. Compares market value to accounting net worth.
- Price-to-sales (P/S) — market capitalization divided by revenue. Useful when earnings are thin, negative, or distorted.
- Dividend yield — annual dividend per share divided by market price per share. The cash return the market is pricing in.
A worked market value ratios example makes the mechanics concrete. A stock trades at 50 dollars with earnings per share of 2 dollars and book value per share of 10 dollars. The P/E is 25, the P/B is 5. Those two numbers say the market pays 25 times current earnings and 5 times accounting net worth for the business. They do not say whether that is reasonable. That part depends entirely on what kind of business it is and what the market expects next.
How to calculate market value ratios without fooling yourself
Learning how to calculate market value ratios is the easy part. The arithmetic is division. The discipline is in the inputs. Trailing earnings describe the past; forward estimates describe a forecast that may not arrive. Book value reflects historical cost, not what assets are worth today. Revenue is harder to manipulate than earnings but tells you nothing about whether the company keeps any of it.
A ratio is only as honest as the number underneath it. Change the denominator from trailing to forward, and the same stock can look expensive or cheap without a single tick of price movement.
This is the most common interpretation error. Two analysts pull the same ticker, use different earnings inputs, and reach opposite conclusions. The price was identical. The lens was not.
Market value ratios interpretation depends on the regime
There is no universal benchmark for what a good market value ratios reading looks like. A P/E of 30 is unremarkable for a software company growing revenue quickly and alarming for a mature utility. A P/B below 1 can flag a bargain or a business the market believes is destroying capital. Context decides which.
Market regime matters as much as sector. In a low-rate environment, investors accept higher multiples because future earnings are discounted less harshly. When rates rise, the same earnings stream is worth less today, and multiples compress across the board without any company doing anything wrong. The ratio moved because the discount rate moved, not because the business changed.
This is also where the framework breaks down. Market value ratios read cleanly when earnings are stable and positive. They become close to meaningless during a loss year, a restructuring, or a cyclical trough, when the denominator collapses and the P/E spikes to a number that looks insane but describes nothing. A cyclical at the bottom of its cycle often shows its highest P/E precisely when it is cheapest. The ratio inverts the signal. Knowing when a ratio stops working is more valuable than memorizing what a normal reading looks like.
Market value ratios versus profitability ratios
It helps to separate market value ratios from profitability ratios, because beginners blur them. Profitability ratios such as return on equity or net margin measure how well the business converts inputs into earnings. They describe the company. Market value ratios describe the price the market attaches to that company. One is about operations; the other is about expectation.
The two work together. A high return on equity tells you the business is efficient. A high P/B tells you the market already knows and has priced it in. The interesting question is the gap between the two: a strong business at a modest multiple, or a mediocre business at a rich one. That gap is where market value ratios earn their place in stock analysis.
How investors actually use market value ratios for stock analysis
Used well, these ratios are a filter and a framing tool, not a trigger. They narrow a universe of names down to a shortlist worth real work. They flag where the market disagrees with the fundamentals, which is where opportunity and risk both live. What they do not do is tell you when to act or where your risk sits if you are wrong.
That last point is the one beginners skip. A stock can stay expensive for years and a cheap stock can get cheaper. The ratio gives you the price the market is paying; it says nothing about whether the trend supports you today or where the level is that proves your thesis wrong. Valuation without that second layer is half an analysis.
The limitations that quietly distort the picture
The limitations of market value ratios are not edge cases; they are baked into the construction. Accounting choices change book value and earnings without changing the underlying business. Share buybacks shrink the share count and flatter per-share figures. Negative earnings make the P/E undefined, which is exactly when you most want a read. Cross-border comparisons collide with different accounting standards.
The deepest limitation is that every market value ratio is backward-looking on the bottom and forward-looking on top. You are dividing yesterday's reported reality into today's expectation of tomorrow. That mismatch is the entire point of the ratio, and also the reason no single reading is ever a conclusion.
Where this leaves the analysis
Market value ratios tell you the price of a thing relative to what it produces. That is genuinely useful and genuinely limited. They compress a complicated picture into one comparable number, which is their strength, and they hide the assumptions inside that number, which is their weakness. Treat them as the opening question of an analysis, never the closing answer. The ratio frames the debate. The conditions around it decide who is right.
Related reading
- Reading earnings quality before trusting a P/E
- Book value versus market value, and why they drift apart
- How interest-rate regimes reprice equity multiples
Worth the read?


