
Gross Profit Margin — What It Tells Investors
Gross profit margin is revenue minus cost of goods sold over revenue. Learn the formula, a worked example, good benchmarks, and how investors read it.
Gross profit margin is the share of revenue a company keeps after paying the direct cost of producing what it sells. You calculate it as revenue minus cost of goods sold, divided by revenue. As a single number it looks simple. As a signal, it tells you how much pricing power and cost control a business actually has before any of the overhead, marketing, or financing decisions enter the picture.
That distinction matters. Most people read a gross profit margin once, compare it to a benchmark they half-remember, and move on. The number only becomes useful when you read it the way you read price: in context, over time, and against the right peer group.
What gross profit margin actually measures
The meaning of gross profit margin is narrow on purpose. It isolates one thing: the profitability of the core product before the rest of the business gets involved.
Revenue is what the company billed. Cost of goods sold, or COGS, is the direct cost of delivering that revenue — raw materials, the labor that physically makes the product, and the freight to ship it. Rent, salaries for the head office, advertising, research, and interest on debt all sit below the gross line. They are real costs, but they are not part of this measure.
So gross profit margin answers a specific question. For every dollar of sales, how much is left after the cost of making the thing? A company at 60% keeps sixty cents per dollar to cover everything else and still turn a profit. A company at 12% keeps twelve. That gap shapes how much room each business has to absorb a bad quarter.
The gross profit margin formula, and the input people get wrong
The gross profit margin formula is straightforward:
Gross profit margin = (Revenue − COGS) ÷ Revenue × 100
The arithmetic is not where mistakes happen. The COGS line is. What a company classifies as a direct cost versus an operating cost is a judgment call, and that judgment moves the margin.
Two companies in the same industry can report different gross profit margins partly because one folds warehouse labor into COGS while the other books it as an operating expense. Neither is necessarily wrong. But it means the margin you are comparing was built on a definition you did not set. Before you trust a comparison, you want to know that both companies are drawing the line in roughly the same place.
This is why the formula is the easy part and the reading is the hard part.
A worked gross profit margin example
A worked gross profit margin calculation makes the mechanics concrete. Take a company with the following quarter.
| Line item | Amount |
|---|---|
| Revenue | $100,000 |
| Cost of goods sold | $35,000 |
| Gross profit | $65,000 |
| Gross profit margin | 65% |
Gross profit is revenue minus COGS: $100,000 − $35,000 = $65,000. Divide that by revenue and multiply by 100, and the gross profit margin is 65%. The company keeps sixty-five cents of every sales dollar before overhead.
The number is only a starting point. A 65% margin is excellent for a hardware maker and unremarkable for a software firm. The figure means nothing until you know what business produced it and what the same business reported a year earlier.
What a good gross profit margin looks like by industry
There is no universal good gross profit margin. The right benchmark is the industry, because the cost structure of the business sets the ceiling.
Rough ranges that show up across sectors:
- Software and professional services: often 60% to 80% or higher, because the cost of delivering one more unit is low.
- Manufacturing: commonly 30% to 50%, depending on scale and automation.
- Retail and wholesale: frequently 20% to 40%, where thin per-unit costs are the norm.
- Capital-intensive and commodity businesses: sometimes single digits, where the product is close to undifferentiated.
A 25% margin is weak for a software company and strong for a grocer. The only honest read on gross profit margin compares a business to its direct peers and to its own history, not to a number borrowed from a different industry.
How investors read the trend, not the number
This is where most analysis stops short. A single-period gross profit margin is a snapshot. The signal investors actually use is the direction over several quarters.
A margin that holds steady through a period of rising input costs is telling you the company has pricing power — it can pass higher costs to customers without losing them. A margin that erodes quarter after quarter is telling you the opposite, even when revenue is still growing. Rising sales with falling gross profit margin often means the company is buying that growth with discounts, and that is a different business than the headline suggests.
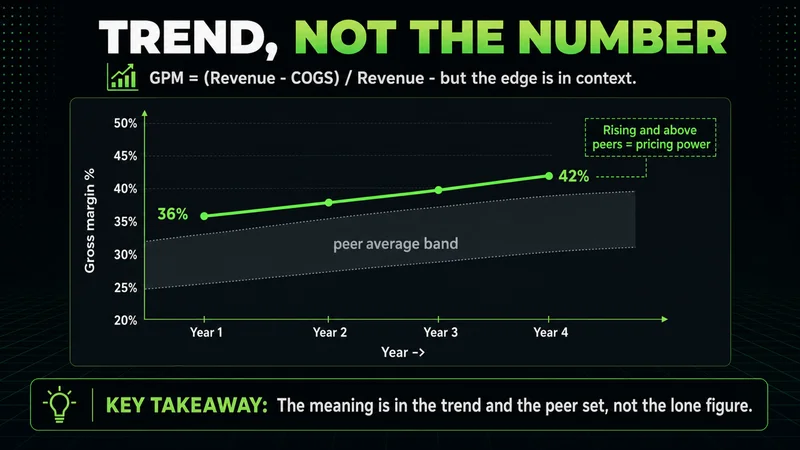
Reading a margin without that context is the financial-statement version of taking a trade without checking the broader market — it is analysis with better vocabulary and no real edge. The interpretation lives in the trend and the peer set, not in the figure on its own. The number tells you where the company is. The trend tells you where it is going.
Gross profit margin vs net profit margin
Gross profit margin and net profit margin describe two different layers of the same income statement, and confusing them leads to bad conclusions.
Gross profit margin stops at COGS. Net profit margin runs all the way down — after operating expenses, interest, taxes, and everything else — and shows what the company actually keeps as bottom-line profit. A business can post a strong gross profit margin and a weak net profit margin if its overhead, debt load, or tax position is heavy.
Read together, the two are more useful than either alone. A high gross margin with a thin net margin points to a strong product carried by a bloated cost base below the gross line. A gross margin that is slipping while the net margin holds suggests the pressure is on production cost, not the rest of the operation. The gap between the two lines is where the real story usually sits.
Where gross profit margin misleads
Gross profit margin breaks down as a comparison tool in a few specific conditions, and knowing them keeps you from drawing the wrong conclusion.
The metric is least reliable when you compare across industries with different cost structures, or across companies that classify costs differently — the COGS judgment call from earlier. It also says nothing about whether the business is profitable overall. A company can run a healthy gross margin and still lose money once overhead and interest are counted, so a strong gross figure read in isolation can mask a struggling operation.
The common mistake is treating one quarter as the verdict. Margins move with input prices, product mix, and one-time costs, so a single soft reading can be noise rather than a trend. The metric works as a comparison within an industry and across time; pulled out of that frame, the same number means almost nothing. Use it to compare like with like, and pair it with the net line before you decide what it is telling you.
FAQs
What is a good gross profit margin? It depends entirely on the industry. Software and service businesses often run 60% to 80%, manufacturing tends toward 30% to 50%, and retail frequently sits at 20% to 40%. Compare a company to its direct peers and its own history rather than to a single universal figure.
How do you calculate gross profit margin? Subtract cost of goods sold from revenue to get gross profit, divide that by revenue, and multiply by 100. A company with $100,000 in revenue and $35,000 in COGS has a 65% gross profit margin.
What is the difference between gross profit margin and net profit margin? Gross profit margin stops after the direct cost of goods sold. Net profit margin runs all the way down the income statement, after operating expenses, interest, and taxes, and shows the company's bottom-line profitability.
Can a gross profit margin be too high? A very high margin is usually a sign of pricing power or low production cost, not a problem. The figure to watch is whether it is stable. An unusually high margin that the company cannot sustain matters more than the level itself.
Why does gross profit margin change between quarters? Input costs, product mix, freight, and one-time production costs all move COGS, which moves the margin. A single quarter's shift is often noise; the trend across several quarters is the part worth reading.
Does a high gross profit margin mean a company is profitable? Not on its own. Gross profit margin ignores overhead, interest, and taxes. A business can post a strong gross margin and still lose money overall, which is why it should be read alongside the net profit margin.
How to use gross profit margin in stock analysis
Gross profit margin earns its place when you stop reading it as a single figure and start reading it as a signal. The calculation is simple; the interpretation is where the value is. A short checklist keeps it disciplined:
- Compare the margin only against direct industry peers and the company's own history, never a borrowed benchmark.
- Track the direction across several quarters — a stable or rising margin through cost pressure signals pricing power.
- Confirm both companies classify COGS the same way before trusting a side-by-side comparison.
- Pair gross profit margin with net profit margin to see whether the strength survives below the gross line.
- Treat any one quarter as a data point, not a verdict.
Read this way, gross profit margin tells you how durable a company's core economics are before the rest of the business gets a vote. That is the question worth answering.
Worth the read?


