
Bull Trap vs Bear Trap — How to Tell Who Is Trapped
A bull trap strands buyers above resistance; a bear trap strands sellers below support. How to read bull trap vs bear trap setups before the reclaim.
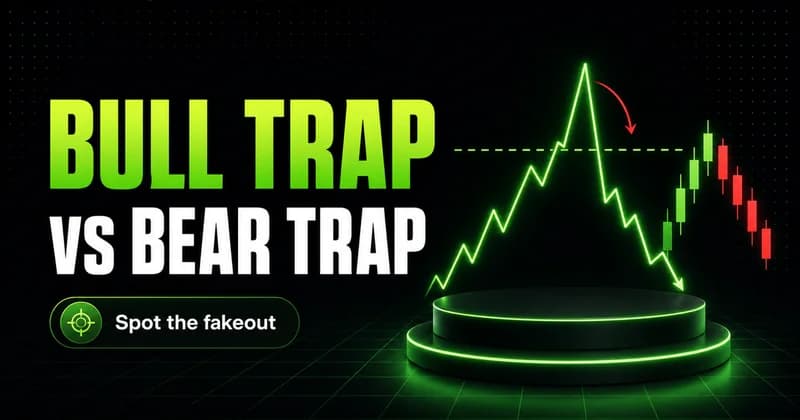
A bull trap is a breakout above resistance that fails and reverses, stranding buyers at the high. A bear trap is a breakdown below support that fails and reverses, stranding sellers at the low. That is the bull trap vs bear trap distinction in one line — same mechanics, opposite direction, different side trapped.
Most traders treat these traps as bad luck. They are closer to a structural feature. A visible level concentrates orders, and the move through it is often the market collecting that liquidity before going the other way. The break itself proves nothing. The reaction after the break is the information.
Bull trap vs bear trap — what each one actually means
The meaning of each trap comes down to who is caught on the wrong side of a failed move.
A bull trap forms when price pushes above a resistance level that traders have been watching, pulls in breakout buyers, and then fails to hold above it. Price rotates back inside the prior range. The buyers who entered on the break are now holding losing positions with stops sitting below, and their forced selling adds fuel to the move down.
A bear trap is the mirror image. Price breaks below an obvious support level, draws in breakout sellers, stops out weak longs, and then reclaims the level. The trapped shorts are forced to cover, and their buying accelerates the move up.
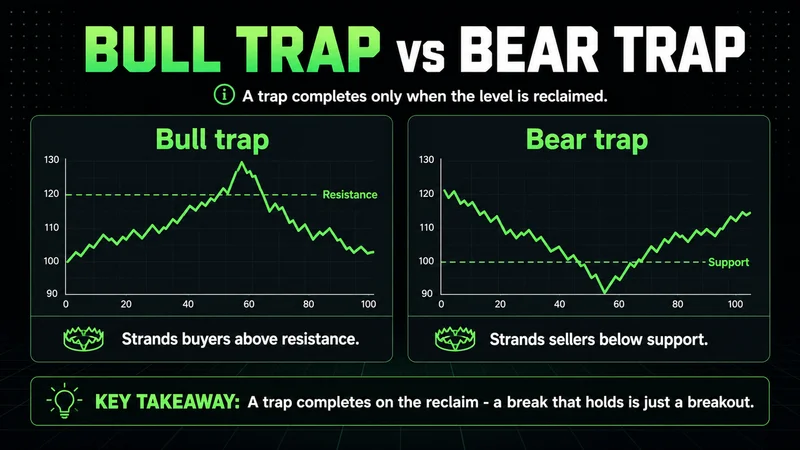
In both cases the trap is complete only when the level is reclaimed. A deep wick through support that closes back above it is a developing bear trap. A clean break that holds and builds acceptance is not a trap at all — it is a breakout doing what breakouts are supposed to do.
The chart pattern both traps share
Strip the labels away and the chart pattern is identical: a widely watched level, a break through it, a failure to find acceptance, and a reclaim that closes price back inside the range.
On a candle-by-candle basis, it usually looks like one of two things. The first is the long wick — price spikes through the level within the bar and closes back inside, leaving a rejection tail. The second is the slower version — one or two full candles close beyond the level, follow-through never arrives, and a strong reversal candle closes back through it. The second version traps more traders because it looks legitimate for longer.
Neither version is exotic. This sequence appears on every instrument and every timeframe, which is exactly why it matters. It is not a rare pattern to hunt for. It is a default behavior around obvious levels.
Why traps form — liquidity, not conspiracy
Resting orders cluster around visible levels. Above a clear resistance high sit two kinds of buy orders: stops from existing shorts and entry orders from breakout traders. That pool of buying is liquidity, and large sellers need it — size cannot be sold into a quiet market without moving price against the seller.
So a push above the high serves a function. It triggers the stops, fills the breakout entries, and gives larger sellers a counterparty at favorable prices. Once that buying is consumed and no continuation appears, the level has nothing left defending it, and price rotates back down through the trapped longs.
This is also why so many breakouts fail in the first place. The trader who buys the first tick through the high is entering emotionally, at the worst price of the move, into the hands of sellers who waited for exactly that moment. The structural entry — the retest or the reclaim — exists because the first break is so often the trap.
How to identify a bull trap vs bear trap on a chart
Identification is mostly about watching what happens after the break instead of acting on the break itself. The signs repeat:
- No acceptance beyond the level. Price breaks out but cannot print consecutive closes beyond it. Each push gets faded quickly.
- Weak participation on the break. The breakout candle expands, but follow-through volume disappears immediately after. Real breakouts attract participation; traps exhaust it.
- The reclaim close. The decisive signal — a candle that closes back through the broken level. Until that close prints, the trap is a hypothesis.
- Displacement after the reclaim. A genuine trap usually resolves fast, because trapped traders all need the same exit. A slow, drifting return through the level is less reliable than a sharp one.
The fourth point separates traps from noise. Stops being run produce momentum. If price reclaims the level and then stalls, treat the read as unconfirmed.
Confirmation signals and indicators that actually help
No indicator identifies a trap on its own. The trading signal is price reaccepting the old range — everything else is supporting evidence. That said, a few tools improve the read:
- Volume comparison. Low volume on the break and expanding volume on the reclaim is the classic trap signature. The opposite — heavy volume on the break, quiet reclaim — favors the breakout.
- Momentum divergence. When the breakout high prints with weaker momentum than the prior high on RSI or a similar oscillator, the break is suspect.
- Close location. Where candles close relative to the level matters more than where their extremes reach. Wicks probe; closes commit.
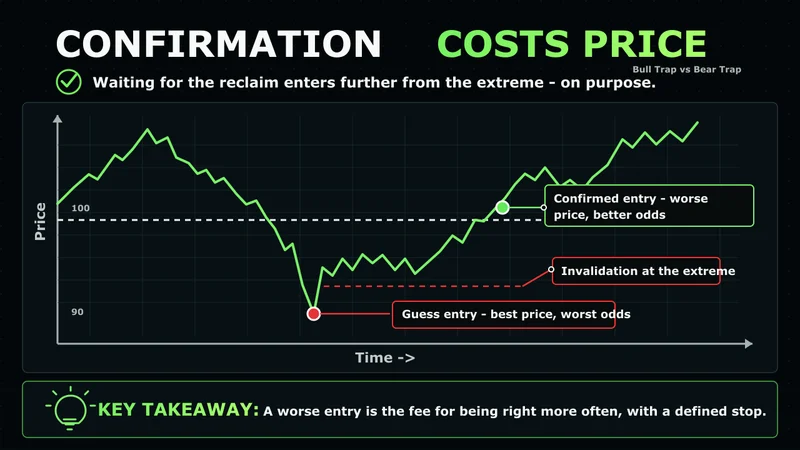
Confirmation costs price. Waiting for the reclaim close means entering further from the extreme than the trader who guessed. That cost is the fee for being right more often — and for having a defined invalidation at the trap's extreme instead of a hope.
Bull trap vs bear trap vs false breakout — same event, three names
A false breakout is the umbrella term: any break of a level that fails to hold. Bull trap and bear trap name the direction and, more importantly, the victim. Call it a false breakout when describing the chart; call it a trap when thinking about who is forced to act next — because the trapped side's exit is the next move's fuel.
| Bull trap | Bear trap | |
|---|---|---|
| Break direction | Up, through resistance | Down, through support |
| Who is trapped | Late buyers | Late sellers |
| Trapped stops sit | Below the reclaimed level | Above the reclaimed level |
| Fuel for the reversal | Long liquidation | Short covering |
| Confirmation | Close back below the level | Close back above the level |
The table is symmetrical for a reason. The pattern does not care about direction. What changes is the positioning context around it, and that context decides how much weight the signal deserves.
Timeframe and session context decide how much a trap means
Traps print on every timeframe, but they do not carry equal weight. Reliability scales with participation. A reclaim on the hourly or daily chart represents far more committed positioning than the same shape on a one-minute chart, where ordinary noise produces trap-shaped candles constantly. For most traders, the practical answer to the best-timeframe question is the highest timeframe they can execute patiently — typically the hourly and above, with the five-minute reserved for timing entries inside that context.
Session matters as much as timeframe, and this is where trap-reading breaks down. A reclaim during regular cash hours, driven by real participation, is information. The same reclaim overnight on thin liquidity means very little — many of those moves are simply repriced at the next session open, and fading them as traps gets expensive. The structure is identical on the chart. The meaning is not.
The mistakes that keep traders walking into traps
Most trap losses follow the same script, and none of it is about pattern knowledge:
- Entering on the first tick through the level. The earliest entry is also the lowest-quality one. Traps are built from exactly this order flow.
- Sizing up because the breakout looks obvious. The cleaner a break looks to everyone, the more liquidity sits behind it — and the more attractive it becomes to fade.
- Moving the stop once trapped. The reclaim was the invalidation. Holding through it converts a small, planned loss into an open-ended one.
- Re-entering immediately to win the loss back. The second attempt is usually about proving the first idea right, not about a new setup, and it tends to lose more than the original trade did.
"The most important rule of trading is to play great defense, not great offense." — Paul Tudor Jones
Getting trapped occasionally is unavoidable. It is an operational cost when risk was predefined and an account event when it was not. The difference between those two outcomes is decided before the entry, never after.
A pre-trade checklist before trusting any breakout
A short checklist, run before entering around any obvious level, removes most trap damage:
- Mark the level everyone can see. If it is obvious to you, it is obvious to the participants who intend to trade against it.
- Wait for the close, not the tick. Decide in advance which timeframe's close confirms the move, and do nothing until it prints.
- Demand acceptance. Look for consecutive closes, and ideally a retest that holds, before treating the break as real.
- Locate the trapped side's stops. Know where the fuel is. If your entry sits inside someone else's stop cluster, expect to be the liquidity.
- Define invalidation before entry. The trap's extreme, or the reclaimed level, is the line. Write it down and size the position from it.
- Check session and timeframe context. A signal printed in thin, low-participation conditions deserves smaller size or no trade at all.
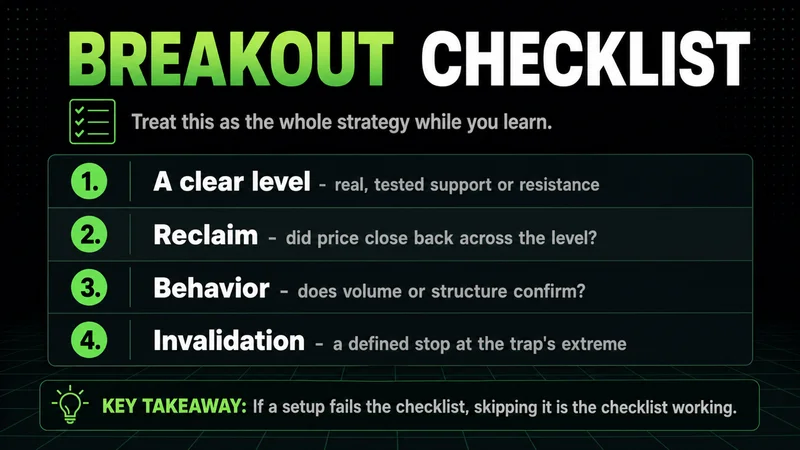
New traders can treat this checklist as the whole strategy for a while. Skipping a setup because it failed the checklist is not a missed opportunity. It is the checklist working.
FAQs
What is a bull trap vs bear trap in simple terms? A bull trap is a breakout above resistance that fails and reverses, catching buyers at the high. A bear trap is a breakdown below support that fails and reverses, catching sellers at the low. The pattern is the same; the trapped side is different.
Is a false breakout the same thing as a bull trap or bear trap? Functionally, yes. False breakout describes the failed move itself, while bull trap and bear trap specify the direction and which side is caught. Every trap is a false breakout; the trap label adds the positioning context.
What is the best timeframe for spotting these traps? Higher timeframes are more dependable. Hourly and daily reclaims represent committed positioning, while one-minute and five-minute charts print trap-shaped noise constantly. A common approach is reading the trap on the hourly or higher and timing the entry on a lower timeframe.
How do you confirm a bull trap or bear trap before trading? Wait for the reclaim — a close back through the broken level — and check that the break happened on weak participation while the reclaim happened on strong participation. Until the reclaim close prints, the trap is unconfirmed and the breakout is still live.
Do indicators reliably identify bull traps and bear traps? No single indicator does. Volume comparison and momentum divergence improve the read, but the decisive signal is price closing back inside the prior range. Indicators support the decision; the level and the close make it.
What should you do if you are caught in a trap? Exit at the predefined invalidation and stand down. The reclaim of the level was the signal that the position was wrong. Moving the stop or averaging into the loss turns a routine, defined loss into the kind that does real damage.
Worth the read?


