
Support Level — How to Read It Without Fooling Yourself
A support level is the price area where demand halts a decline. Learn to read, confirm, and risk-define a support level before you ever click buy.

A support level is a price area where buying has repeatedly absorbed selling and stopped a decline. That is the textbook part, and it is the part most traders overweight. The level itself is not the edge. What price does when it arrives there is the edge. A support level only matters when it tells you where you are wrong, not where you are right.
Most beginners treat a support level as a buy signal. Price drops to a line they drew, so they buy. Then they watch it slice straight through, and they call the level "fake." The level was never the problem. The reaction was. This guide walks through what a support level actually is, how to read one on a chart, how to confirm it before committing risk, and the mistakes that quietly turn a clean level into a losing trade.
What a support level actually means
The support level meaning is simple once you strip the jargon. It is a price area where demand has been strong enough, more than once, to halt a fall and turn price back up. Sellers run out of conviction. Buyers step in. The decline stalls.
Notice the word "area." A support level is rarely a single price. It is a band where supply and demand have changed hands before, and the market remembers that band. Price has reacted there, so participants expect it to react there again. That expectation is part of what makes the level work. It is reactive behavior, not a law of physics.
The level forms because real orders sit there. Some traders are waiting to buy. Others who sold earlier are waiting to cover. Resting bids cluster around prices that mattered in the recent past. When price returns, those orders absorb the selling, and the decline pauses. No order flow, no support.
How to identify a support level on a chart
A support level chart example is easier to read than to draw. Pull up any liquid market and find the spots where price stopped falling and reversed. Those swing lows are your raw material.
Here is how to identify a support level on a chart without overcomplicating it:
- Mark the obvious swing lows where price clearly rejected lower prices and turned up.
- Look for prices that were tested more than once. Two or three touches carry more weight than one.
- Favor levels that produced a sharp, decisive bounce over levels price drifted away from slowly.
- Connect the level to broader context: is the market trending, ranging, or transitioning?
The more often price has respected an area, the more participants are watching it, and the more orders tend to rest there. A level touched three times and held is more meaningful than a line you fit to a single wick. One touch is a data point. Repeated reactions are a pattern.
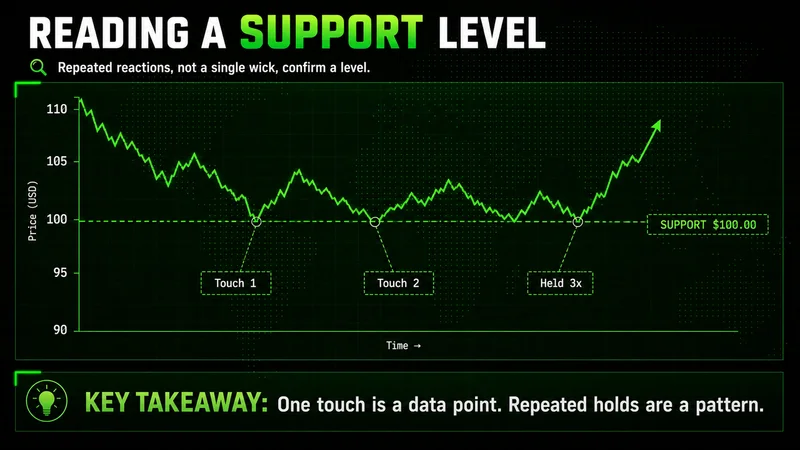
Resist the urge to clutter the chart. If you have drawn nine support levels, you have drawn none. The market does not respect every minor low. Keep the levels that are obvious, tested, and structurally significant. Delete the rest.
Support level versus support zone
The phrase "support level" suggests a precise price. In practice, price almost never honors a single number. This is where the support level vs support zone distinction matters, and it is the difference that trips up most newer traders.
A level is a line. A zone is a band around that line that accounts for noise, wicks, and the simple fact that thousands of participants are not all acting at the exact same price. Treating a zone as an exact line is one of the most common reasons traders get stopped out a few ticks before the real reaction.
| Support level (line) | Support zone (band) | |
|---|---|---|
| Definition | A single price | A range around that price |
| Best for | Quick reference, clean markets | Real conditions, volatile markets |
| Risk of exact entry | High — wicks blow through it | Lower — accounts for noise |
| How to draw it | One horizontal line | A box from wick lows to body lows |
Use the line to orient yourself. Use the zone to manage risk. When you mark support, draw it from the body lows to the wick extremes so you have a band to work with, not a tightrope.
How to confirm a support level before you enter
A support level confirmation is the part beginners skip and professionals insist on. Price reaching a level is information. Price reacting at a level is confirmation. They are not the same thing.
Price arriving at support tells you where to look. Price holding support tells you whether to act.
So how do you confirm a support level before entering a trade? You wait for the reaction, then read it. A long lower wick into the zone followed by a strong close back inside it shows buyers stepping in. A shift in lower-timeframe structure, where price stops making new lows and starts making higher lows, shows the same thing from a different angle. Acceptance below the zone, where price trades there and stays, tells you the opposite: the level is failing.
Confirmation does not guarantee the trade works. It improves the probability, and it gives you a defined point where you are clearly wrong. That defined invalidation is the entire reason to wait. Buying the touch without a read on the reaction is not analysis. It is a guess dressed up in technical language.
This is also where the approach breaks down, so name it plainly: confirmation reads cleanly in normal conditions and means almost nothing during a fast, news-driven flush. When volatility expands and liquidity thins, price can wick through a tested zone, print a convincing bounce, and then fail anyway because the order flow that built the level is no longer there. On those sessions, the level you trusted yesterday is just a line on a screen.
Which timeframe's support level should you trust
The best timeframe for support level analysis depends on how you trade, but the principle is constant: higher-timeframe levels carry more weight. A support level timeframe question is really a question about how many participants are watching.
A daily or weekly support level is visible to far more traders than a five-minute level. More eyes mean more resting orders, which means a stronger reaction. When you are deciding which level to respect, the higher timeframe wins the tie.
The practical method is to align timeframes. Mark your major levels on the higher timeframe, then drop down to a lower one to read the reaction and time the entry. The higher timeframe tells you where. The lower timeframe tells you when. Trading a lower-timeframe level against the higher-timeframe trend is how traders end up fighting the market instead of reading it.
How a support level shapes your risk
Here is the part the top guides on this topic tend to skip, and it is the part that actually protects an account. A support level is a risk tool before it is an entry tool.
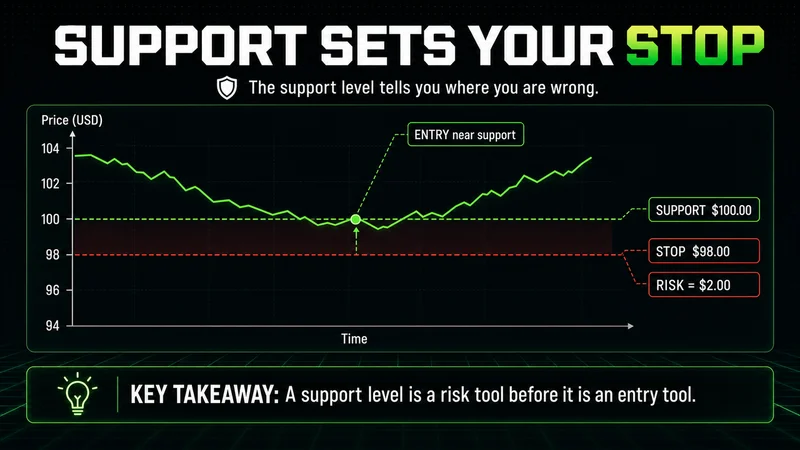
When you buy near support, the level defines your invalidation. If price accepts below the zone, the reason you entered is gone, and so is the trade. That gives you a clean place for a stop: below the zone, not on the line, where noise will not knock you out for no reason. Knowing exactly where you are wrong lets you size the position correctly. The distance from entry to invalidation sets your risk per trade. The level does the work.
This is how a support level affects trading risk in the most direct way possible. Without a defined level, you are guessing where to put the stop, which means you are guessing at your risk. A mediocre entry with a defined invalidation survives. A perfect entry with no plan for being wrong eventually does real damage. Most traders do not have an analysis problem. They have a discipline problem, and it usually shows up in where they place, or fail to place, the stop.
Common support level mistakes beginners make
The common support level mistakes beginners make are predictable, and every one of them is avoidable.
- Treating the level as a buy button. Price touching support is not a signal. Reaction is. Buying the touch without confirmation is the single most expensive habit.
- Drawing a line instead of a zone. Exact prices get wicked through. A zone respects how markets actually move.
- Ignoring context. A support level in a strong downtrend is weaker than the same level in a range. The broader structure decides whether the level has a chance.
- Over-marking the chart. Nine levels is the same as no levels. Keep the significant ones.
- Skipping invalidation. If you cannot say where the level fails, you do not have a trade. You have a hope.
Most account damage does not come from bad levels. It comes from good levels traded without a plan for being wrong.
Each of these comes back to the same root cause: confusing the level with the trade. The level is context. The trade is what you do with the reaction, the confirmation, and the risk.
A support level checklist for new traders
Before you act on any level, run through a short support level checklist. This keeps the process repeatable and removes the emotion from the decision.
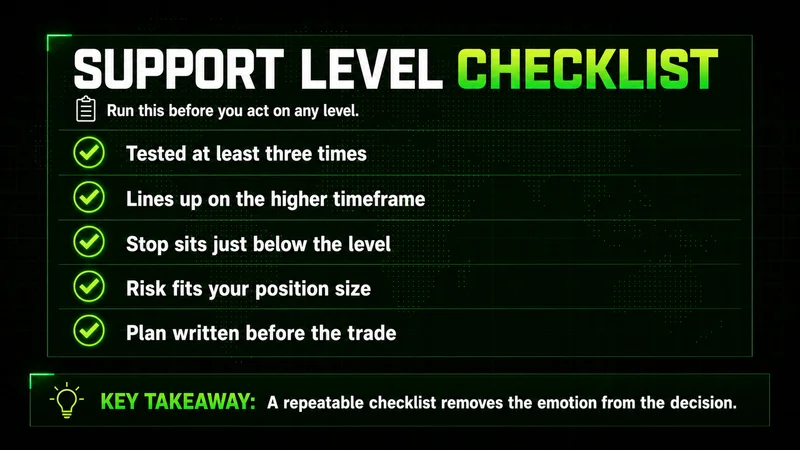
- Is the level tested more than once, with a clear prior reaction?
- Is it drawn as a zone, from body lows to wick extremes?
- Does the higher timeframe agree with the level?
- Is the broader market trending into it, ranging, or transitioning?
- Has price actually reacted, or has it only arrived?
- Do you know the exact point, below the zone, where the level is invalidated?
- Does the distance to that invalidation give you risk you can accept?
If every answer is clear, you have a structurally sound reason to act. If any answer is vague, the highest-quality decision is usually to wait. Waiting is part of the job, and a support level you skip is almost always cheaper than one you force.
A support level is not a prediction. It is a reference point that tells you where demand has shown up before, where you would be wrong, and how much you stand to lose finding out. Read it that way and it becomes one of the most useful tools on the chart. Treat it as a guarantee and it becomes one of the most expensive.
Keep building the foundation
Support levels sit inside a larger framework of market structure, liquidity, and risk-defined execution. If this was useful, keep working through the related concepts: how resistance forms and mirrors support, how to read market structure shifts, and how to size a position once your invalidation is defined. The level is one piece. The process around it is what compounds.
Worth the read?


