
Inflation — What It Means and How Traders Read It
Inflation is the rise in the general price level over time. For a trader, what matters is how far the print lands from what the market expected.
Inflation is the rate at which the general price level of goods and services rises over time, which steadily erodes what each unit of currency can buy. Most explainers stop there. For a trader, the definition matters far less than the reaction: an inflation number rarely moves price by what it says, and far more by how far it lands from what the market already expected.
That gap between the print and the expectation is where positioning lives. The headline tells you the cost of living. The market tells you whether it was already priced in. Those are two different signals, and confusing them is how traders lose money on data they read correctly.
What inflation means in plain terms
The inflation meaning most people carry around is simple enough: things cost more this year than last. A cart of groceries, a tank of gas, a month of rent. When the broad price level climbs, each dollar holds less purchasing power, and the same paycheck covers less.
Economists track this as an annual percentage. A 3% inflation rate means the basket of goods that cost 100 dollars a year ago now costs roughly 103. The number is backward-looking by design. It measures what already happened to prices, not what will happen next.
That backward-looking quality is the first thing a trader has to respect. Inflation data describes a period that has already closed. The market, by the time the figure prints, is usually trading the next one.
How inflation is calculated
Inflation calculation starts with a basket. Statistical agencies select a fixed set of goods and services that represent typical household spending, then track the price of that basket over time. The most common gauge in the United States is the Consumer Price Index, or CPI.
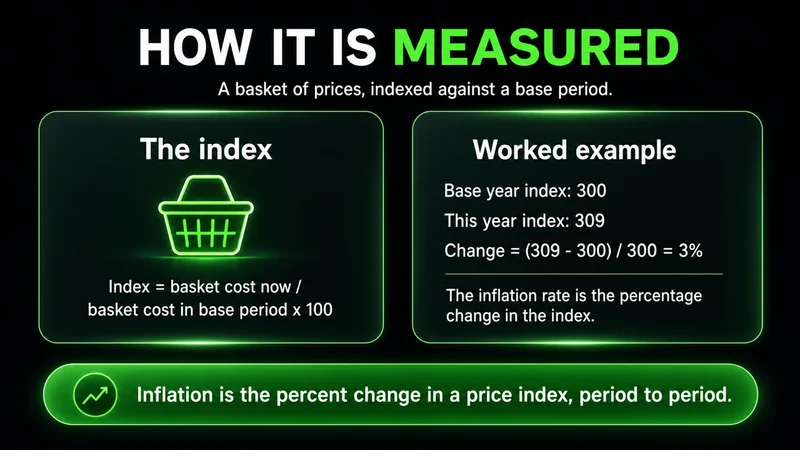
The mechanics are straightforward. You divide the cost of the basket in the current period by its cost in a base period, which produces an index value. The inflation rate is the percentage change in that index from one period to the next. If the index moves from 300 to 309 over a year, that is a 3% annual rate.
Two refinements matter for anyone reading the data:
- Core versus headline. Core inflation strips out food and energy, which are the most volatile components. Headline inflation includes them. The two can diverge sharply, and the market often weighs core more heavily because it filters out short-term noise.
- CPI versus PCE. The Personal Consumption Expenditures index uses a broader, more adaptive basket and is the measure the Federal Reserve watches most closely. When the Fed talks about its target, it is usually talking about PCE.
Knowing which series moved, and by how much against expectations, is the difference between reading an inflation report and trading it.
Why inflation is treated as a core economic indicator
Inflation is an economic indicator because it sits at the center of how a central bank sets policy. When prices rise faster than the bank wants, the typical response is higher interest rates to cool demand. When prices stall or fall, the response is usually the opposite.
That policy reflex is the real reason inflation matters to markets. A trader is rarely positioning on the price of eggs. The position is on what the figure implies for rates, liquidity, and the cost of holding risk. Higher rates make borrowing more expensive, compress the present value of future earnings, and pressure the most rate-sensitive parts of the market first.
This is why an inflation print can move equities, bonds, and currencies in the same minute. It is one number, but it feeds the expected path of policy, and policy expectations are priced across every asset class at once.
How inflation affects the stock market
The inflation impact on stocks runs through a few channels at once, and they do not all point the same direction.
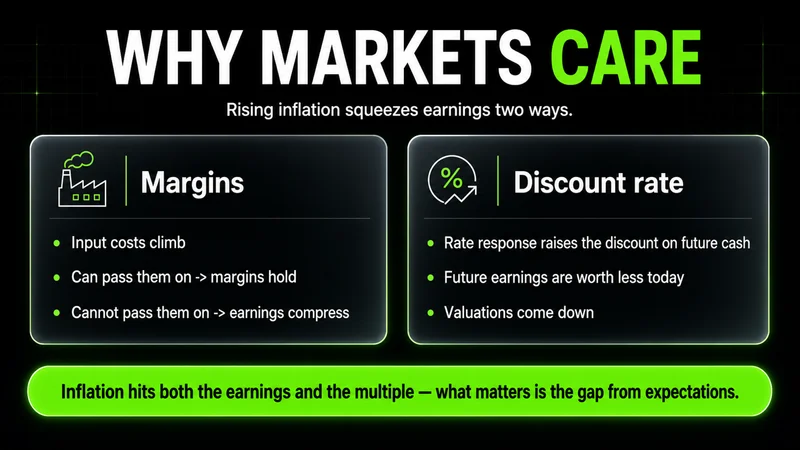
When inflation rises, input costs climb. Companies that can pass those costs to customers protect their margins. Companies that cannot watch earnings compress, and falling earnings expectations pull stock prices down with them. At the same time, the rate response raises the discount applied to future cash flows, which hits long-duration growth and technology names harder than steady cash generators in energy, staples, and healthcare.
Severity is the part most explainers skip. When inflation runs low and stable, equities have historically absorbed it without much trouble. The problems concentrate when it runs hot and unpredictable, because uncertainty about the policy path is what markets price worst.
Volatility is the cleanest read on an inflation surprise. Price is not telling you whether inflation is good or bad. It is telling you how wrong the consensus was.
For a short-term trader, that expansion in volatility is the actual event. A hot print can drive selling and buying in the same session as positioning unwinds and resets, and the direction is often secondary to the move itself.
Inflation versus deflation as a market regime
Inflation and deflation are not just opposite numbers. They are different regimes, and the tape behaves differently in each. Inflation vs deflation matters less as vocabulary than as a read on what kind of market you are trading.
Inflation tends to coincide with tightening policy, rising rate expectations, and pressure on long-duration assets. Deflation, a sustained fall in the general price level, tends to coincide with weak demand, easing policy, and a flight toward safety. The first punishes rate-sensitive growth; the second punishes anything tied to a slowing economy.
For execution, the regime sets the backdrop. A breakout in an easing environment behaves differently from the same breakout while the central bank is still tightening into a hot inflation trend. Context first, then the setup.
How traders actually use an inflation print
Here is the part most explainers leave out: what you actually do when the number hits. An inflation trading signal is not the headline itself. It is the reaction relative to what was expected.
The cleanest approach is sequential, not reflexive:
- Know the expectation before the release. The consensus estimate is the line the surprise is measured against. Without it, you are reacting to a number with no reference point.
- Let the first move resolve. The initial spike after a major print is frequently the trap. It is liquidity reacting, not structure forming.
- Trade the structure that develops after. Once the knee-jerk move sweeps liquidity and either holds or fails, the second move usually carries the cleaner read.
This is one of the few places where waiting is the edge. The first move after major news is often not the cleanest opportunity, and many traders lose money reacting emotionally to the volatility spike instead of letting structure develop. The data does not need to be traded in the first second. It needs to be traded once the market shows whether the surprise was accepted or rejected.
When this approach breaks down: during a print that lands almost exactly on expectations. With no surprise, there is no reaction to trade, and forcing a position into a quiet release manufactures risk where the market is not offering opportunity. The framework works on the gap between print and expectation. Remove the gap and there is nothing to read.
The limits of inflation data
Inflation limitations are real, and treating the number as precise truth is a common mistake. The basket is fixed and updated infrequently, so it lags shifts in how people actually spend. Substitution, quality changes, and housing measurement all introduce noise, and the headline figure is an average no individual actually experiences.
For a trader, the practical limit is simpler. The number is backward-looking, revised after the fact, and only useful in relation to expectations. It tells you where prices have been, not what the market will do with that information, and the second question is the one that pays.
What to carry forward from an inflation report
Inflation is the steady rise in the general price level, measured against a basket of goods and reported as an annual percentage. As a definition it is simple. As a trading input it is conditional on one thing: the gap between the print and what the market already expected.
Read the series that moved, compare it to consensus, and respect the regime it sits inside. Let the first reaction resolve before committing, and accept that a number landing on expectations gives you nothing to trade. Inflation is a backward-looking figure that the market trades forward, and that distinction is where the discipline lives.
Worth the read?


