
Operating Profit Margin — What It Tells Investors
Operating profit margin shows how efficiently a company turns revenue into operating profit. Here is the formula, a worked example, and how to read it.
Operating profit margin is the share of revenue a company keeps after paying the costs of running its core business, before interest and taxes. You calculate it by dividing operating income by revenue, then multiplying by 100. It is a profitability ratio, and it answers one direct question: how efficiently does this business turn sales into operating profit?
Most people read the number and stop there. That is the mistake. A single operating profit margin tells you almost nothing on its own. It only becomes useful when you compare it against the company's own history and against the sector it competes in. A number without that context is just a number.
What operating profit margin actually measures
Operating profit margin isolates the profitability of the core business. It strips out interest expense and taxes, both of which depend on financing choices and jurisdiction rather than on how well the company sells its product and controls its costs. What remains is operating income, often called EBIT — earnings before interest and taxes.
That isolation is the point. Two companies can sell identical products at identical revenue and report very different net profits simply because one carries more debt or operates in a higher-tax region. Operating profit margin removes those distortions and shows the quality of the operation itself.
The operating profit margin meaning becomes clearer with a frame. Gross profit margin looks only at revenue minus the cost of goods sold. Net profit margin looks at what is left after everything, including financing and taxes. Operating profit margin sits in the middle, and that middle position is where operational discipline shows up most plainly.
The operating profit margin formula and calculation
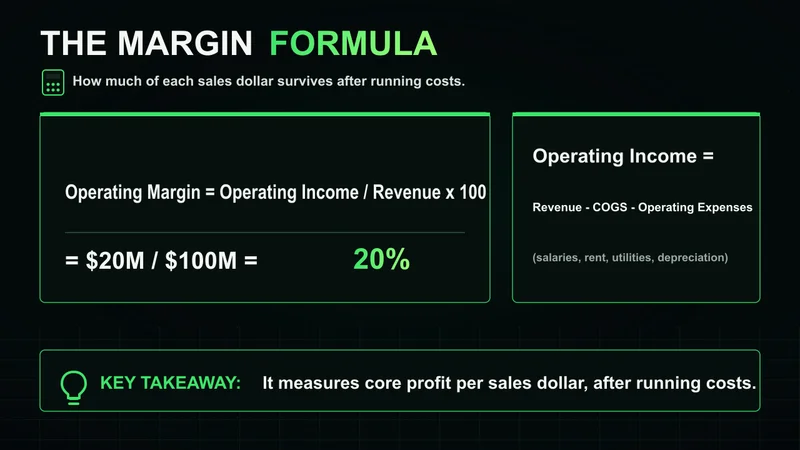
The operating profit margin formula is straightforward:
Operating profit margin = (Operating income / Revenue) × 100
Operating income is revenue minus the cost of goods sold and minus operating expenses such as salaries, rent, utilities, depreciation, and overhead tied to running the business. The operating profit margin calculation has two steps:
- Subtract the cost of goods sold and operating expenses from revenue to get operating income.
- Divide operating income by revenue and multiply by 100 to express the result as a percentage.
Here is a worked operating profit margin example. Assume a company reports the following for the year:
| Line item | Amount |
|---|---|
| Revenue | $2,000,000 |
| Cost of goods sold | $1,100,000 |
| Operating expenses | $600,000 |
| Operating income (EBIT) | $300,000 |
Operating income is $300,000. Divide that by $2,000,000 in revenue and multiply by 100. The operating profit margin is 15%. In plain terms, the company keeps 15 cents of operating profit for every dollar of revenue. That is the operating profit margin formula and example in one pass — the arithmetic is simple, and the interpretation is where the work begins.
How to read operating profit margin interpretation correctly
A higher margin generally signals tighter cost control and stronger pricing power. A lower or falling margin points to rising costs, pricing pressure, or both. That much is in every guide. The part most explanations skip is that the absolute level matters far less than two comparisons.
First, the trend. One year of 15% says little. Three years moving from 11% to 13% to 15% says the operation is improving. The same 15% arriving after a slide from 22% says something is breaking down. Read the direction before you judge the level.
Second, the peer set. Margins vary enormously by industry. A grocery chain running a 3% operating margin can be perfectly healthy, while a software business at 3% would be in trouble. Comparing a company's operating profit margin to an unrelated sector produces a conclusion that looks rigorous but means nothing. Context is the whole job here — a margin number read in isolation is analysis with better vocabulary, not analysis.
Operating profit margin vs gross profit margin
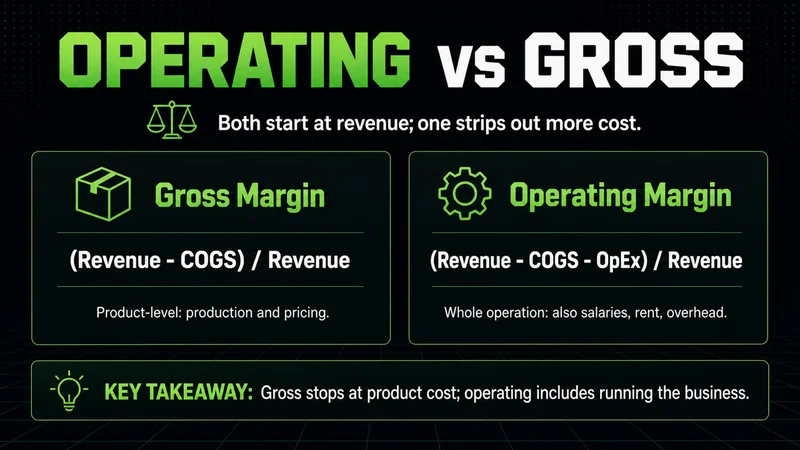
The operating profit margin vs gross profit margin distinction trips up many beginners. Gross profit margin measures revenue minus the cost of goods sold, divided by revenue. It captures production efficiency and pricing on the product itself. It does not account for the cost of actually running the company.
Operating profit margin goes one layer deeper. It subtracts the operating expenses that gross margin ignores: salaries, marketing, administration, research, and overhead. A company can post a strong gross margin and a weak operating margin when its overhead is bloated. That gap between the two is one of the most useful things a reader can study, because it shows whether a healthy product is being eaten alive by the cost of running the business around it.
How investors use operating profit margin
Investors use operating profit margin as a read on operational quality and management discipline. A stable or rising margin across several periods suggests a business that controls its costs and holds its pricing. Practically, the metric earns its place when you use it for the right comparisons:
- Track the same company's margin across several years to see the direction of operational health.
- Compare the margin against direct competitors in the same industry, never against unrelated sectors.
- Pair it with gross margin to locate where profitability is being won or lost.
- Watch for sudden jumps that come from one-time items rather than from the core operation.
Where operating profit margin breaks down
This is where the metric earns its operating profit margin limitations. The ratio assumes operating income is clean, and it often is not. A single large asset sale, a restructuring charge, or an accounting reclassification can move the margin in a way that has nothing to do with the underlying business. The number reads cleanly on the page while telling you something false.
The framework also inverts during periods of heavy investment. A company spending aggressively to expand can show a depressed operating margin that signals strength, not weakness, because the spending is building future capacity. Read that margin as a problem and you misjudge the business entirely. The metric works as a measure of steady-state efficiency; it misleads during transitions, restructurings, and one-off events. That is the condition where the clean formula stops describing reality, and the only fix is to read the income statement underneath it rather than the ratio on top of it.
Key takeaways
Operating profit margin measures how efficiently a company turns revenue into operating profit, before interest and taxes. The operating profit margin formula is operating income divided by revenue, times 100. The number is only useful in context: read the trend across periods, compare against true industry peers, and pair it with gross margin to see where profitability is built or lost. Treat any sudden move with suspicion until you have checked whether it came from the core operation or from a one-time event. Read carefully, compare deliberately, and the ratio becomes a reliable lens on operational quality rather than a number that flatters or misleads.
Worth the read?


