MACD Trading Strategy for Beginners — Read Momentum
A MACD trading strategy for beginners works when you read the indicator as momentum context and confirm with structure, not as a trigger.
A MACD trading strategy for beginners works best when you stop treating the indicator as a buy and sell button. MACD, short for Moving Average Convergence Divergence, measures momentum: it compares two moving averages of price and shows when the shorter one is pulling away from or closing in on the longer one. That is useful information. It is not a signal to act on by itself, and most beginners learn that the hard way.
The promise sold online is that a MACD crossover tells you when to enter and exit. The reality is closer to this: MACD describes momentum that already happened, and price has to cooperate for the description to matter. Read it as context, align it with structure, and it earns a place in your process. Read it as a trigger, and it will hand you a steady stream of trades that look clean on a flat chart and fall apart the moment conditions change.
What the MACD indicator actually measures
The MACD indicator strategy starts with understanding what the tool is built from. There are three parts, and each one tells you something different about momentum.
- The MACD line is the difference between a 12-period and a 26-period exponential moving average. When momentum builds, the two averages separate and the line moves away from zero.
- The signal line is a 9-period exponential moving average of the MACD line. It smooths the MACD line and lags it slightly, which is what makes a MACD crossover possible.
- The histogram plots the gap between the MACD line and the signal line as bars. It grows when momentum is expanding and shrinks when momentum is fading.
Those three components are the entire indicator. The default 12, 26, 9 settings are the standard for a reason, and it helps to know what each number controls before touching it:
- 12 sets the fast exponential moving average, which reacts quickly to recent price.
- 26 sets the slow exponential moving average, which holds the longer trend.
- 9 smooths the MACD line into the signal line that the cross is measured against.
Those defaults are responsive enough to react and slow enough to filter some noise. Beginners are usually better served learning to read them before changing anything, because every faster setting buys earlier signals at the cost of more false ones.
What matters is the idea underneath the math. MACD is a momentum tool layered on top of moving averages. It is not predicting the next move. It is summarizing the current one, and that distinction decides how you should use it.
The MACD crossover strategy, read honestly
The MACD crossover is the first thing every beginner is taught, so it deserves a clear explanation and an honest one.
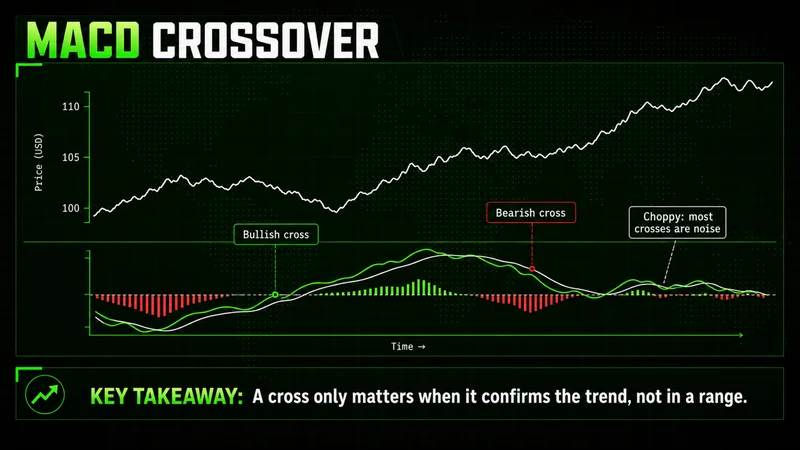
A bullish crossover happens when the MACD line crosses above the signal line. A bearish crossover happens when it crosses below. The textbook reading is simple:
- MACD line crosses above the signal line points to building upside momentum.
- MACD line crosses below the signal line points to building downside momentum.
- The histogram flips sign at the moment of each cross, turning positive on a bullish cross and negative on a bearish one.
The mechanics are real. The problem is that crossovers fire constantly, and a large share of them lead nowhere. In a sideways market the MACD line and signal line tangle around the zero line, crossing back and forth while price chops in a range. Each cross looks like a signal. Most are noise.
This is the core mistake. A crossover is not a reason to enter. It is a momentum event that may or may not align with what price is actually doing. The traders who get value from the MACD crossover strategy are the ones who ignore most crossovers and act only on the few that confirm a move they already expected from the chart.
Reading the MACD histogram for momentum
The MACD histogram is the part most beginners underuse, and it often carries more information than the crossover itself.
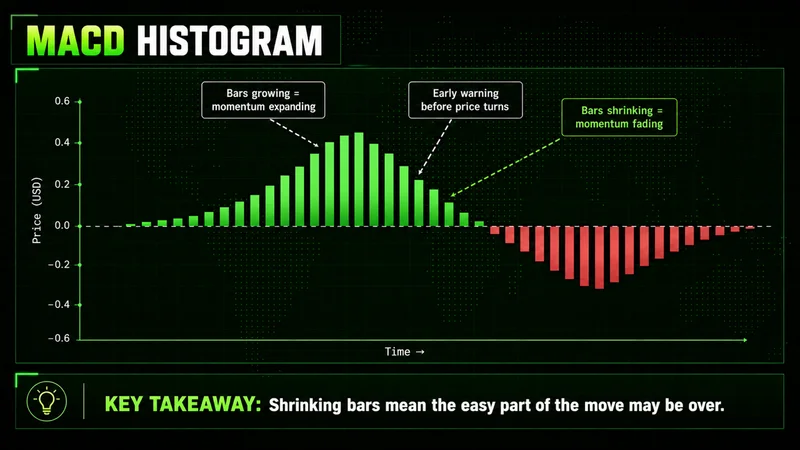
Each bar measures the distance between the MACD line and the signal line. The direction of the bars tells you whether momentum is accelerating or decelerating:
- Bars growing taller mean the gap is widening and momentum is expanding in the current direction.
- Bars shrinking toward zero mean momentum is fading, even if price is still moving.
- Bars crossing the zero line mark the crossover itself, after the fade has already played out.
The practical edge is in the shrink. When a strong move is underway and the histogram bars start contracting, momentum is leaving the move before the crossover confirms it. That early warning is why the histogram is worth watching. It does not tell you to reverse your position. It tells you the easy part of the move may be over, which is a cue to tighten management, not to flip direction on a single bar.
Used this way, the MACD histogram becomes a momentum gauge rather than another trigger. It answers one question well: whether the current move is getting stronger or weaker right now.
How to confirm trades instead of chasing crossovers
Here is the belief that shapes everything else: indicators are tools, not decision-makers. Most beginners overload a chart searching for certainty the market does not offer, and MACD becomes one more thing flashing for attention. The fix is to demote it. MACD confirms; structure decides.
A confirmation-first approach treats the MACD strategy as a filter on top of the chart, not a replacement for it. The order of operations matters:
- Read the structure first. Identify the trend and the key levels from price itself, before looking at the indicator. Decide where you would want to be involved and where you would be wrong.
- Check momentum with MACD second. Once price reaches a level you care about, use the MACD line, signal line, and histogram to ask whether momentum supports the move you are considering.
- Act only when they agree. If price is breaking a level you marked and MACD momentum is expanding in the same direction, the trade has alignment. If price is at your level but MACD is flat or fading, the setup is weaker, and waiting is usually the better choice.
This is slower than reacting to every crossover, and that is the point. Waiting for price and momentum to agree filters out most of the trades that would have lost. A MACD confirmation that lines up with a level you marked in advance is worth more than ten crossovers taken in isolation, because the crossover by itself carries no context, and an entry with no context is just a guess dressed in technical language.
In practice, alignment is a short checklist before you commit. A confirmed MACD setup usually has all three of these in place:
- A level that matters, marked from price before the indicator was consulted.
- Momentum agreeing with the direction of the break, shown by the MACD line and an expanding histogram.
- A defined invalidation: a price that says the read was wrong and closes the trade.
The same logic applies to a MACD trend strategy on higher timeframes. Beginners usually do better starting on daily or weekly charts, where each signal carries more weight and the noise that floods lower timeframes is filtered out by the longer period. Slower charts make the confirmation cleaner.
When the MACD strategy stops working
No strategy works in all market conditions, and MACD has two conditions where it fails predictably. Naming them is more useful than pretending the indicator is reliable everywhere.
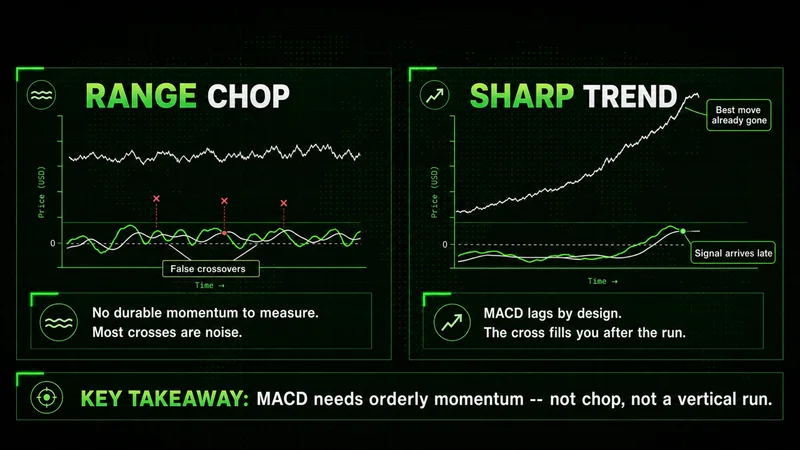
The two failure modes are worth holding in mind as a filter before any MACD trade:
- Range-bound chop gives the indicator no durable momentum to measure, so it churns out false crossovers.
- Sharp, fast trends move faster than a lagging average can confirm, so the signal arrives late and badly priced.
The first is range-bound, low-volatility chop. MACD is a momentum tool, and a sideways market has no durable momentum to measure. The line and signal cross repeatedly around zero, the histogram flickers, and every cross looks actionable. In that environment the MACD crossover strategy produces a stream of false signals, and a beginner trading each one will get cut by a thousand small losses. When price is ranging and volatility is compressed, the cleaner decision is to stand aside until structure gives a real break.
The second is a sharp, fast trend. MACD is built on moving averages, so it lags by design. In a violent directional move the crossover arrives well after price has already traveled, and entering on that late signal means buying the part of the move with the worst reward and the highest risk. The signal that reads cleanly in hindsight is the one that fills you at the top of the run.
That is the honest boundary. MACD is most useful in a market with real but orderly momentum, where price trends with enough patience to let the indicator confirm without being either too quiet to register or too fast to follow. Knowing when not to trust it is as much a part of the strategy as the crossover itself.
Common MACD mistakes beginners make
Most of the damage comes from a short, repeatable list. None of these are advanced errors. They are the predictable result of treating MACD as a signal generator instead of a momentum gauge.
- Trading every crossover. The majority lead nowhere, especially in a range. Selectivity is the edge.
- Ignoring market structure. A crossover with no level behind it has no context, and context is what makes any entry worth taking.
- Using fast settings to get in earlier. Tighter parameters create more signals, and most of the extra ones are false. The default exists for a reason.
- Acting on lower timeframes as a beginner. The noise on short charts overwhelms the signal. Slower charts filter it.
- Sizing for the win instead of the loss. A confirmation tool does not remove risk. Position size still has to assume the trade is wrong.
The thread running through all five is the same. MACD describes momentum. It does not guarantee the next move, and any process that forgets that will eventually find out the expensive way.
FAQs
What is the MACD trading strategy in simple terms? It is a way of using the Moving Average Convergence Divergence indicator to read momentum and confirm trades. You watch the MACD line, the signal line, and the histogram for signs that momentum supports a move, then act only when that momentum agrees with what price and structure are already showing.
What are the best MACD settings for beginner traders? The default 12, 26, 9 settings are the standard, and most beginners should learn to read them before changing anything. Faster settings produce earlier signals but far more false ones, so the responsiveness you gain is usually paid back in noise.
How do you confirm trades with MACD? Read structure first, then use MACD second. Identify the trend and key levels from price, and only when price reaches a level you care about do you check whether the MACD line, signal line, and histogram show momentum supporting the move. Act when price and momentum agree.
Is the MACD crossover strategy reliable on its own? No. Crossovers fire constantly, and many lead nowhere, particularly in a sideways market where the line and signal tangle around zero. The crossover only becomes useful when it confirms a move you already expected from the chart, not as a standalone trigger.
What does the MACD histogram tell you? It shows whether momentum is expanding or fading. Growing bars mean the move is strengthening, and shrinking bars mean momentum is leaving the move even while price is still moving. Contracting bars during a strong move are an early cue that the easy part may be over.
When does the MACD strategy fail? In two conditions. Range-bound, low-volatility chop produces a stream of false crossovers because there is no durable momentum to measure. Sharp, fast trends arrive too late because MACD lags by design, so the signal fills you well after the best part of the move has passed.
Worth the read?