False Breakout Trading Strategy — Fade the Trap
A false breakout trading strategy trades the failure, not the breakout: fade the liquidity sweep when the level fails and price reclaims the prior range.

A false breakout trading strategy trades the failure, not the breakout. When price pushes past an obvious support or resistance level, fails to hold, and snaps back inside the range, that rejection is the signal. The break ran the stops sitting at the level, and the reversal that follows is often a higher-probability move than the breakout traders chased.
That framing matters because most traders see a failed breakout as a setup that went wrong. It is the opposite. The trap is the trade. The level everyone watches is where liquidity collects, and the edge is not predicting the fakeout. It is reacting to the reclaim with defined risk once the level holds.
What a false breakout trading strategy actually trades
A breakout is price moving through a level and accepting outside it. A false breakout is the same move without the acceptance. Price trades through, sometimes closes through, then loses the level and returns inside the range. The strategy waits for that return, treats the swept level as the line in the sand, and positions for continuation back through the range.
The structure is simple to name and harder to execute: a clear level, a push beyond it, a failure to hold, and a reclaim of the broken side. A false breakout reversal is what you get when all four line up. This is a reactive approach, not a predictive one. You are not calling the top of the wick before it forms. You are reading what price did after it reached for the level, then acting on confirmation.
Why false breakouts happen: the liquidity sweep behind the move
Obvious levels attract orders. Traders place stops just beyond the prior high or low because that is where their idea is wrong, and breakout traders queue entries at the same spots. All of that resting interest sits in a predictable pocket, and a predictable pocket of liquidity is a target.
Larger participants need size filled without moving price against themselves. Pushing a few ticks past the obvious high triggers the stops resting there. Those stops become market orders, the surge of fills provides the liquidity to absorb a larger position, and once that liquidity is taken the move has nothing left to drive it. Price stalls, then reverses. This is the liquidity trap, and it is why so many clean-looking breaks fail within a few bars.
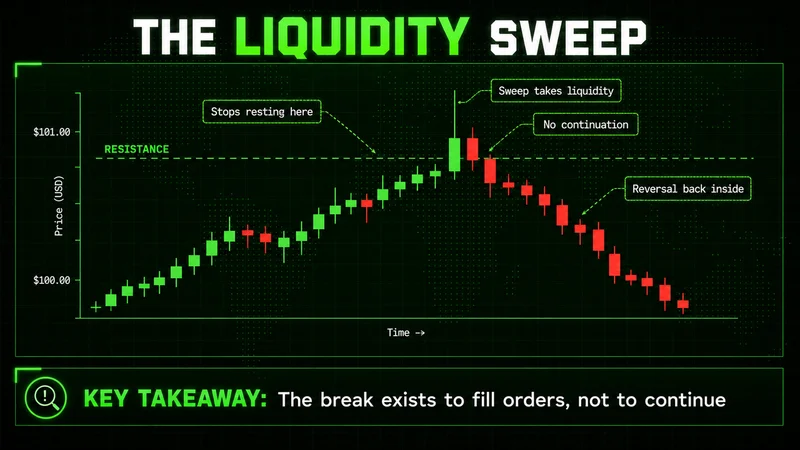
The failure to continue is the information: the break was about filling orders, not a real shift in direction. Where the orders sit explains this pattern better than any view on price.
False breakout vs real breakout: the reclaim is the tell
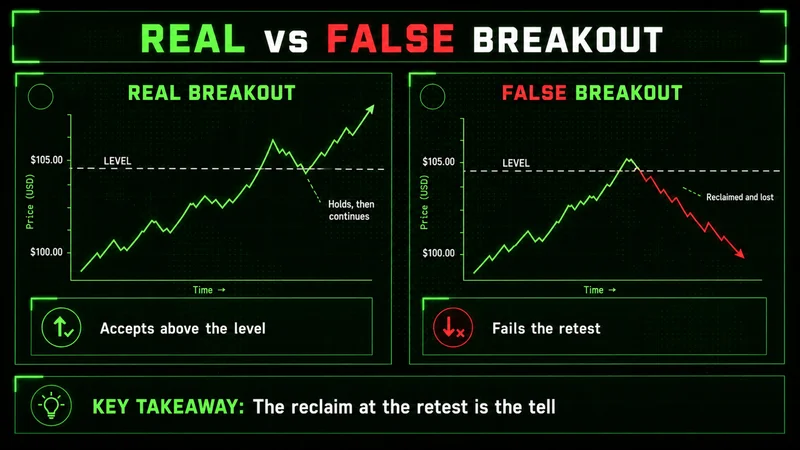
The hard part is separating a false breakout from a real one in real time. Both start the same way: price leaves the range. A real breakout holds the broken level as new support or resistance, then expands. A false breakout fails that test: price cannot hold above the broken high, sellers reclaim it, and the move folds back inside. The reclaim on the original side is the tell that the break was false.
| Behavior | Real breakout | False breakout |
|---|---|---|
| Move through the level | Holds and accepts outside | Trades through, then fails |
| Pullback to the level | Level becomes support or resistance | Level is reclaimed and lost |
| Momentum after the break | Continuation, expansion | Stalls, reverses inside the range |
| What it tells you | Direction shifted | Liquidity was taken, no continuation |
A few cues tilt the read toward a false break before the reclaim:
- The push past the level stalls immediately, with no follow-through bar behind it.
- Volume spikes into the break, then dries up rather than expanding with the move.
- Price closes back inside the range on the same candle that broke it.
None confirm the trade alone. They raise the probability that the break was a liquidity grab and tell you to wait for the reclaim rather than chase.
How to trade false breakouts at support and resistance, step by step
A simple, repeatable sequence keeps this out of guesswork. The setup lives at marked support and resistance, so the levels get drawn before the session.
- Mark the level. Identify a clear prior high or low the market is likely to test.
- Let price take the level. Wait for the push beyond it and the failure to hold. No reclaim, no trade.
- Enter on the reclaim. Position once price closes back inside the range on the original side, using the swept extreme as the boundary.
- Define invalidation. Place the stop beyond the wick of the sweep. If price reclaims the broken side again, the idea is wrong and you are out.
- Manage toward the opposite side of the range. The far boundary is the logical first objective, and partials along the way protect the position.
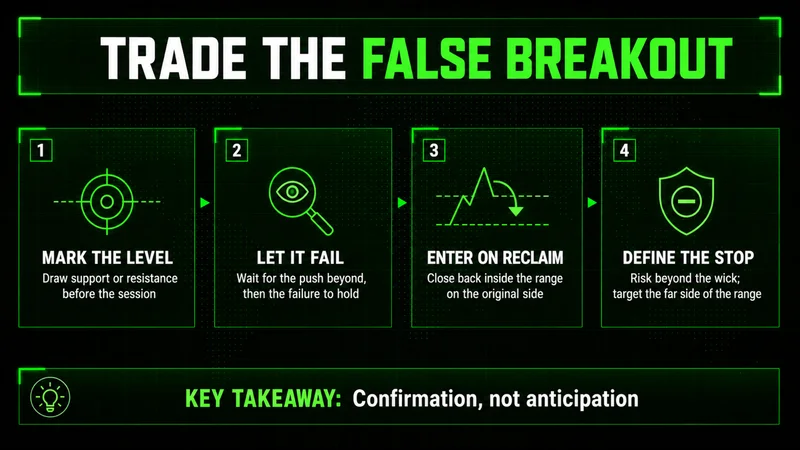
The entry trigger is confirmation, not anticipation. Risk is defined by structure: the sweep made a clean extreme, and that extreme is your line. A false breakout strategy with support and resistance is only as good as the levels behind it.
When fading the false breakout is the losing trade
This setup has a regime where it stops working, and naming it is more useful than pretending the pattern is universal. The fade reads cleanly in one type of market and falls apart in another, so the regime has to be checked.
In a strong trend with expanding volatility, the break is usually real. Price clears the level, barely pulls back, and continues, because the order flow behind it is genuine demand rather than a liquidity grab. Fading that break means standing in front of a move with momentum behind it, and the reclaim you are waiting for never comes. On instruments that turn over fast, that mistake shows up within a few bars and is expensive to hold.
The filter is context. Ranges and balanced conditions favor the fade, because liquidity grabs happen at the edges of established ranges. Trend days and high-volatility expansion favor the breakout. When structure is trending hard and the level breaks on real displacement, the higher-probability decision is to stand down. Trading the false breakout without that context is gambling with better vocabulary.
Common false breakout trading mistakes
Most of the damage in this strategy comes from a handful of repeatable errors, not the pattern itself. Avoiding fake breakout traps is mostly about avoiding these.
- Entering before the reclaim. Anticipating the fakeout instead of waiting for confirmation puts you in the trade the sweep was built to catch.
- Trading the fade in a strong trend. The break is real more often than not when volatility is expanding and structure is trending.
- Skipping the level work. Without levels marked ahead of time, every wick looks like a sweep and the setup loses its definition.
- Oversizing the entry. If one stop-out beyond the wick rattles your next decision, the size was too large.
- Ignoring acceptance. A wick through the level is a test; a close through it is acceptance. Treating the two the same is how false signals get traded.
None of these come from reading the chart wrong. They come from breaking the sequence under pressure, which is what turns a sound setup into avoidable losses.
FAQs
What is a false breakout trading strategy in simple terms? It trades the failure of a breakout rather than the breakout itself. When price pushes past a support or resistance level, fails to hold, and reclaims the original side, you position for the reversal back into the range, with risk defined at the swept extreme.
How do you confirm a failed breakout? Wait for acceptance back inside the range. A close back through the broken level on the original side is confirmation; a wick alone is only a test. The reclaim with a close separates a real failure from a level still being contested.
What is the difference between a false breakout and a real breakout? A real breakout holds the broken level as new support or resistance and continues. A false breakout trades through, fails to hold, and reverses back inside the range. The behavior at the retest settles which one you are looking at.
Why do false breakouts happen so often at obvious levels? Stops and breakout orders cluster just beyond obvious highs and lows, and that resting liquidity is a target. A push past the level triggers those orders, and once the liquidity is taken the move stalls and reverses.
Worth the read?